Overview of South Australia’s environment
As context for the rest of the report, it is useful to consider the main aspects of South Australia’s physical and socio-economic environment, how these have changed over time and how they relate to one another.
Natural environment
Land
South Australia has a land area of 984 221 square kilometres (of which about 4600 square kilometres are on islands) and a coastline of 5067 kilometres (3816 kilometres of mainland coastline and 1251 kilometres of island coastline). The land area is 12.7% of Australia’s total and the state is fourth largest of Australian states and territories. South Australia’s coastal waters cover 60 032 square kilometres. More than 80% of the state is less than 300 metres above sea level; Mount Woodroffe is the highest peak at 1435 metres. The lowest place is Lake Eyre at 15 metres below sea level. The vicinity of Lake Eyre is also the area of South Australia’s (and Australia’s) lowest rainfall. The area occupied by agriculture makes up 53.6% of South Australia and this increased from 49 126 square kilometres in 2009 to 52 786 square kilometres in 2011 (ABS 2012a).
South Australia’s land area is divided into eight natural resource management regions (Figure 2):
- Adelaide and Mount Lofty Ranges
- Alinytjara Wilurara
- Eyre Peninsula
- Kangaroo Island
- Northern and Yorke
- South Australian Arid Lands
- South Australian Murray–Darling Basin
- South East.
Climate
South Australia’s rainfall and temperatures are highly variable, both in range and location. After an extended drought, 2010 was South Australia’s third wettest year and 2011 the fifth wettest year on record. This was followed by, in 2012, the driest year since 2006, with December 2012 the driest December in 18 years. The first three months of 2011 were the wettest since records began in 1900 for South Australia as a whole. The spring of 2012 was the warmest on record; 2009 was the warmest year on record and the 17th consecutive year of above-average temperatures. Temperatures for the past decade have averaged 0.7% above the 1961–90 mean temperature, showing a steady rise in annual temperatures since the 1970s. The warmest year on record for maximum temperatures across the state was 2007, and 1956 was the coldest. The highest maximum temperature ever recorded in South Australia (and Australia) was 50.7 ºC in Oodnadatta on 2 January 1960 (BoM and CSIRO 2012).
Ecosystems and biodiversity
No species loss—a nature conservation strategy for South Australia 2007–2017 (DEH 2007), divides the state into three biomes (areas with similar climates and ecosystems): two terrestrial (arid and mediterranean) and one marine. The arid biome makes up 87% of the state, and is characterised by a warm-to-hot and dry climate with low and erratic rainfall, with mostly winter rains in the south and summer rains in the north. The mediterranean biome, which makes up the remaining 13%, has a cool-to-warm climate, tending to winter rains. There is some form of conservation protection on 28% of the arid biome and 14% of the mediterranean biome. The marine biome, of which 5% is protected, covers the equivalent of 6% of the South Australian land area. The marine biome is characterised by variable and diverse currents with low-nutrient, sheltered, salty gulf waters; warmer waters in the bight; and cooler, nutrient-rich waters in the south-east (DEH 2007).
About one-quarter (more than 1000 species) of all terrestrial vascular plants and vertebrate animals in South Australia are considered to be threatened—63% of the state’s mammals and 22% of the state’s vascular plants are formally listed as threatened. There are insufficient data to assess the status of some vascular plants and vertebrate animals and virtually all nonvascular plants and invertebrates (DEH 2007).
The paucity of information on a number of aspects of the natural environment is a key constraint on the effectiveness of state of the environment reporting. For 50% of the 14 indicators of natural resource condition in the state, confidence in the supporting data is described as low. The confidence in the data for six other indicators is described as medium and there are no data of high confidence (Government of South Australia 2012).
-01_fmt.jpeg)
Figure 2 South Australia’s eight natural resource management regions
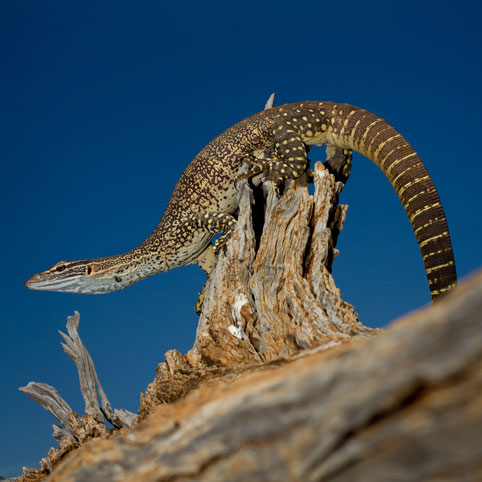
Sand monitor
Angus Kennedy
People
Aboriginal Australians lived in Australia and South Australia for at least 40 000 years before the arrival of European settlers. The Kaurna people, who occupied the Adelaide Plains, used the natural resources efficiently and had a skilled pattern of guardianship of the land that included the effective use of fire to hunt game and to promote the growth of particular types of vegetation. The first migrants arrived in South Australia in 1836, and at the end of the first year the estimated migrant population was 546. The first census held in 1844 showed a population of 17 366. By 1921 the state’s population passed 500 000 and in 1963 it passed 1 000 000 (Atlas South Australia 2012). In June 2011 the state’s population was 1.64 million—an increase of 4.5% since 2006 (ABS 2012b).
Impact on the environment
The main interactions between people and the environment come from the direct and indirect use of natural resources such as air, land (especially its geological assets), water and energy, and from the generation of waste and pollution.
In spite of limitations of the methodology, human impact on the environment is often described in terms of an ‘ecological footprint’, which estimates the amount of land and ocean area required to sustain human consumption patterns and absorb human wastes. The footprint provides a measure of the extent to which humanity is using nature’s resources faster than they can regenerate. When human resource extraction and waste generation exceed an ecosystem’s ability to regenerate resources and to absorb the generated waste, it leads to a depletion of Earth’s life-supporting natural capital and a build up of wastes.
The ecological footprint is typically expressed in global hectares per person. Earth’s biological capacity (the capacity of an area to provide resources and absorb wastes) to sustain the world population was estimated as 1.8 global hectares per person in 2008. At the same time the average global ecological footprint was 2.7 global hectares per person, which means that we are depleting the planet’s future ecological stocks faster than they can regenerate.
Australia’s footprint is estimated at 6.7 global hectares per person—the seventh highest of all nations (Figure 3; GFN 2012). If everyone in the world consumed the same as the average Australian, we would need the natural resources of 3.76 Earths. There is some variation between states, with the average, footprint in Victoria estimated to be somewhat higher than the national average at 6.8 global hectares, and the Australian Capital Territory estimated at 9.2 global hectares (OCSE 2011). In comparison, the footprint of the average person in India is less than 1 hectare; in China, 2.1 hectares; and in New Zealand, 4.3 hectares. Australia’s, including South Australia’s, large footprint is caused by our lifestyles, which use large amounts of natural resources in an inefficient way (State of the Environment 2011 Committee 2011), and, significantly, for export rather than our own use.
Seen in isolation from the rest of the world, the large Australian footprint does not seem to be a major concern considering that Australia’s biological capacity is estimated at 14.6 hectares per person (GFN 2012). However, there is a steady convergence of Australia’s ecological footprint and its biological capacity. The footprint is increasing as the population increases and becomes more affluent, and the capacity is decreasing with environmental changes—it has more than halved since 1960. Also, because of globalisation of trade, markets and economies, it is not practical to take a single-country perspective on the sustainable use of resources.
Australia’s comparatively poor global environmental performance in terms of the ecological footprint is also evident from the Environmental Performance Index (EPI), which ranks 132 countries on 22 environmental performance indicators. The 2012 EPI (the seventh iteration of this measurement project) ranks Australia 48th in current performance and 79th in trend performance over the past decade. This ranking becomes of greater concern if divided into its two main components: environmental health (effects on human health) and ecosystem vitality. Australia is ranked 10th on environmental health’s effects on human health but 106th on ecosystem vitality (Yale University 2012).
Environmental understanding
To reduce depletion of the world’s natural resources and to make our lifestyles more sustainable requires an awareness of the relationships between production, consumption and natural resources. From 2007–08 to 2011–12 there was no discernible change in environmental conditions other than improved rainfall, and evidence pointed to an ongoing declining trend in key environmental indices. Yet Australians were about 20% less concerned and more optimistic about the environment in 2011–12 than they were in 2007–08 (ABS 2012c).In that four-year period, the percentage of people who think the environment is in good condition has more than doubled (Figure 4a). The percentage of people who think it is in bad condition has more than halved. The same is true for the perception of the trend in the condition of the environment (Figure 4b). Interpretation
Australia
-01_fmt.jpeg)
World
-01.jpg)
Source: GFN (2012)
Figure 3 Australia’s ecological footprint versus its biocapacity, and that of the rest of the world
of these findings should consider that perceptions are influenced by a number of factors and can change quickly (ABS 2012c).
In spite of this increased optimism, more than 60% of Australians were still concerned about environmental issues. This apparent concern and awareness of environmental decline is, however, not reflected in our behaviour (Macquarie University 2010). Environmental considerations seem to play a relatively small part in decisions about what and how much we consume. The reasons for this disconnect include:
- the ‘economic invisibility of nature’ (the general lack of monetary values of natural resources)
- the effects of marketing and consumer attitudes
- a lack of science education and consumer information
- a growing separation between an increasingly urbanised and affluent society and its awareness of, and connection to, the natural world.
Economy
Mining and agriculture have played a key role in South Australia’s economic development since the start of settlement. Following the discovery of copper in Kapunda in 1842 and subsequent discoveries in what became known as the Copper Triangle, mining contributed significantly to the prosperity of the state in its early days.
Soon after settlement, the first pastoral leases were granted and the first winery in the Barossa Valley started operating. Both mining and agriculture continue to grow, with South Australia’s mineral exports earning $4.22 billion in 2010–11 (up from $2.85 billion in 2009–10) and agriculture contributing close to $5 billion (almost half) of the state’s overseas exports annually. However, today about 45% of the state’s economy is based in services, while traditional economic sectors of mining and agriculture collectively make up about 10%. The remainder is made up of construction, housing and utilities (19%), manufacturing (9%), and retail and wholesale trade (9%). The food and wine industry, agricultural exports and tourism rely on a healthy environment. More than 30% of South Australia’s exports consist of agricultural products (EDB 2013).
Figure 5 shows the growth in the South Australian economy measured in changes in gross state product (Figure 5a), and in the import and export of goods and services between 2003–04 and 2011–12 (Figure 5b). Export of goods is clearly the largest proportion of trade and is growing. South Australia’s average annual goods and services export growth over the last five years was 3.3%.
a
A-01_fmt.jpeg)
b
B-02_fmt.jpeg)
Source: ABS (2012c)
Figure 4 Perceptions of the condition of the environment, (a) 2008 and (b) 2011
a
A-01_fmt.jpeg)
b
B-01_fmt.jpeg)
Source: ABS (2012c)
Figure 5 South Australia’s (a) gross state product and (b) international trade, 2003–04 to 2011–12
As international trade increases, the production of goods can become increasingly detached from direct consumption. Goods exported carry with them embodied consumption of materials such as water, minerals, metals and chemicals, as well as carbon emissions.
In 2011–12, South Australia had 4.3% of Australia’s exports in goods and 3.8% of Australia’s exports in services (Table 1).
|
Goods ($m) % share of Australian trade |
Services ($m) % share of Australian trade |
Total ($m) % share of Australian trade |
|||||||||||||||||||||||||||||||||||||||||||||||||||||||||||||||||||||||||||||||||||||||||||||||||
|---|---|---|---|---|---|---|---|---|---|---|---|---|---|---|---|---|---|---|---|---|---|---|---|---|---|---|---|---|---|---|---|---|---|---|---|---|---|---|---|---|---|---|---|---|---|---|---|---|---|---|---|---|---|---|---|---|---|---|---|---|---|---|---|---|---|---|---|---|---|---|---|---|---|---|---|---|---|---|---|---|---|---|---|---|---|---|---|---|---|---|---|---|---|---|---|---|---|---|---|
|
Source: DFAT (2012) | |||||||||||||||||||||||||||||||||||||||||||||||||||||||||||||||||||||||||||||||||||||||||||||||||||
|
Exports |
11 416 4.3 |
1 927 3.8 |
13 343 4.2 |
||||||||||||||||||||||||||||||||||||||||||||||||||||||||||||||||||||||||||||||||||||||||||||||||
|
Imports |
7 261 3.0 |
2 198 3.6 |
9 459 3.2 |
||||||||||||||||||||||||||||||||||||||||||||||||||||||||||||||||||||||||||||||||||||||||||||||||
South Australia’s major exports in 2011–12 were (DFAT 2012):
- wheat $1627 million
- wine $1146 million
- copper $1140 million
- copper ores and concentrates $960 million
- iron ores and concentrates $945 million
- meat (excluding beef) $499 million
- lead $408 million
- vegetables $272 million
- passenger motor vehicles $272 million
- seeds and vegetables $206 million.
The story of Lake Eyre in a changing climate
‘At the heart of Australia, framed by desert, Lake Eyre, the country’s biggest lake, seldom sees water. Most of the time is a vast salt pan, eerily empty, devoid of all life. But when the rains come and the great rivers flow down to its basin, an astonishing transformation takes place: the landscape fills with colour, with bird and animal life and with crowds who have come to witness nature’s grandest performance.’ Lockyer (2012)
The Lake Eyre Basin, located some 700 kilometres north of Adelaide, is the lowest point in Australia at about 15 metres below sea level when empty. It includes parts of South Australia, Queensland, the Northern Territory and New South Wales. The lake was formed by aeolian processes after tectonic deformation at the end of the Pleistocene epoch. On the rare occasions that it fills it is Australia’s largest lake and 18th largest in the world, with a surface area of 9500 square kilometres.
The Lake Eyre Basin is one of the few unregulated dryland river systems in the world, and the largest unregulated river system in Australia. The lake’s official name was changed in December 2012 to combine the name ‘Lake Eyre’ with the Aboriginal name, ‘Kati Thanda’. Native title over Kati Thanda–Lake Eyre and surrounding region is held by the Arabuna people.
The lake is divided into two sections joined by the Goyder Channel. These are known as Lake Eyre North which is 144 kilometres long and 65 kilometres wide, and Lake Eyre South which is 65 kilometres by 24 kilometres. The lake is fed by local rain and the large north-eastern catchments of the Diamantina and Warburton rivers which provide on average 64% of the flow volume to the lake, with the Cooper River providing 17% of the volume (Kotwicki 1986). The lake typically floods to about 1.5 metres every three years, 4 metres every 10 years and fills or near fills a few times in every 100 years. The water soon evaporates by the end of the following summer, leaving a massive saltpan. Some water remains in over 200 smaller sub-lakes.
The filling of the lake is greatly influenced by climate patterns, with highest water levels occurring during strong La Niña years. The highest flood level of 6 metres occurred in 1974. Kati Thanda–Lake Eyre experienced a four-year run of flooding events from 2009 to 2012. In 2009, the flood peaked at 1.5 metres with 9 cubic kilometres of water crossing the Queensland–South Australia border. Most of the water came from massive floods in the Georgina River. The greater proportion soaked into the desert or evaporated en route to the lake leaving less than 4 cubic kilometres in the lake, covering 800 square kilometres or 12% of the lake. High rainfall in 2010 sent flood water into the Diamantina, Georgina and Cooper Creek catchments with Cooper Creek reaching the lake for the first time since 1990. In 2011, heavy local rain filled Lake Eyre South, with Lake Eyre North about 75% covered with water firstly from the Neales and Macumba, and later from the Warburton River. In 2012, a combination of heavy floods in Queensland and significant local rainfall saw the lake covered by water over 90% of its area.
A recent assessment of the health of its rivers found them to be in near-natural condition (LEBSAP 2008). Kati Thanda–Lake Eyre, Coongie Lakes and Goyder Lagoon are unique ecosystems that support massive booms in populations of waterbirds (such as Australian pelicans, silver gulls, red-necked avocets, banded stilts and gull-billed terns), fish, macroinvertebrates, vegetation and other biota during large flood events. These sites are considered unique at a national and international level and provide outstanding examples of the evolution of aquatic ecosystem and biological processes in arid environments with few counterparts elsewhere in the world (Morton et al. 1995). After reaching peak water levels in 2012, within weeks the lake was again essentially empty with all of the ecological consequences one might expect, waiting on the next big rains.
References
- Kotwicki V (1986). Floods of Lake Eyre, South Australian Engineering and Water Supply Department, Adelaide.
- Lockyer P (2012). Lake Eyre: a journey through the heart of the continent, HarperCollins Publishers, Australia.
- LEBSAP 2008 (2008). State of the basin 2008: rivers assessment, Lake Eyre Basin Scientific Advisory Panel, Commonwealth of Australia, Canberra.
- Morton SR, Doherty MD and Barker RD (1995). Natural heritage values of the Lake Eyre Basin in South Australia: World Heritage assessment, CSIRO Division of Wildlife and Ecology, Canberra, prepared for the Australian Government Department of the Environment, Sport and Territories.
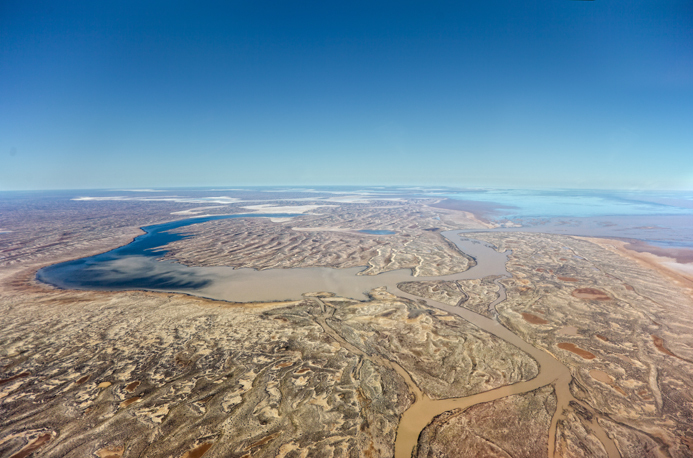
Lake Eyre in flood
Kim Wirth