2 What do we know about it?
The State Natural Resources Management Plan (Government of South Australia 2012) provides an assessment of the condition and extent of key natural resources in South Australia, shown in Table 1.
|
Key natural resource |
Condition |
Trend |
|||||||||||||||||||||||||||||||||||||||||||||||||||||||||||||||||||||||||||||||||||||||||||||||||
|---|---|---|---|---|---|---|---|---|---|---|---|---|---|---|---|---|---|---|---|---|---|---|---|---|---|---|---|---|---|---|---|---|---|---|---|---|---|---|---|---|---|---|---|---|---|---|---|---|---|---|---|---|---|---|---|---|---|---|---|---|---|---|---|---|---|---|---|---|---|---|---|---|---|---|---|---|---|---|---|---|---|---|---|---|---|---|---|---|---|---|---|---|---|---|---|---|---|---|---|
|
Source: Government of South Australia (2012) | |||||||||||||||||||||||||||||||||||||||||||||||||||||||||||||||||||||||||||||||||||||||||||||||||||
|
Native vegetation extent and condition |
Fair/moderate |
Declining |
|||||||||||||||||||||||||||||||||||||||||||||||||||||||||||||||||||||||||||||||||||||||||||||||||
|
Soil condition in production areas |
Fair/moderate |
Variable |
|||||||||||||||||||||||||||||||||||||||||||||||||||||||||||||||||||||||||||||||||||||||||||||||||
|
Geological features and landscapes |
Variable |
Variable |
|||||||||||||||||||||||||||||||||||||||||||||||||||||||||||||||||||||||||||||||||||||||||||||||||
|
Aquatic ecosystem extent and condition |
Variable |
Variable |
|||||||||||||||||||||||||||||||||||||||||||||||||||||||||||||||||||||||||||||||||||||||||||||||||
|
Coastal and marine ecosystem extent and condition |
Variable |
Declining |
|||||||||||||||||||||||||||||||||||||||||||||||||||||||||||||||||||||||||||||||||||||||||||||||||
|
Status of threatened species and ecological communities |
Poor |
Declining |
|||||||||||||||||||||||||||||||||||||||||||||||||||||||||||||||||||||||||||||||||||||||||||||||||
|
Impact of introduced species |
Poor |
Declining |
|||||||||||||||||||||||||||||||||||||||||||||||||||||||||||||||||||||||||||||||||||||||||||||||||
In this section, biodiversity is discussed with reference to native vegetation, and threatened species and ecological communities. Wetlands and rivers, and their associated flora and fauna, are covered in the Water chapter.
2.1 Native vegetation
Native vegetation is a key component of South Australia’s environment. It provides habitat and a source of food for wildlife; maintains the health of land, soil and water (Williams 2005); and mitigates the impacts of a warming climate through carbon storage and climate regulation (Australian Greenhouse Office 2006, Emes et al. 2006). Native vegetation provides many economic, social and cultural benefits, and is important for Aboriginal culture (Williams 2005).
2.1.1 Native vegetation extent
Of South Australia’s 984 221.37 square kilometres in land area (DSEWPaC 2010), native vegetation covers approximately 85%. The arid northern parts (covering 87% of the state) have had minimal vegetation clearance, and approximately 96% of vegetation cover remains. Much of this is used to sustain pastoral industries and is degraded as a result.
In contrast, temperate areas (the remaining 13% of the state) with higher rainfall have experienced much higher vegetation clearing rates in the past, and only 26% of native vegetation remains in these areas. Much of the native vegetation in the southern parts of South Australia has been cleared for agriculture and human settlements since the 19th and 20th centuries (Figure 1). The remaining vegetation is now fragmented, especially in the southern Mount Lofty Ranges, where the patches are too small to support bird biodiversity (Westphal et al. 2003, 2007; Bradshaw 2012). Native forests are now estimated to cover only 9% of the state’s total area and in some areas, such as the Adelaide Plains and adjacent Mount Lofty Ranges, as little as 4% cover remains (Bradshaw 2012).
Large-scale clearing of native vegetation ceased after the introduction of the Native Vegetation Act 1991. Vegetation clearing can be undertaken under some circumstances, but it must be offset by restoration work (see Section 4.1.1). Table 2 shows statistics for vegetation clearance applications under the Act between 2009–10 and 2011–12.
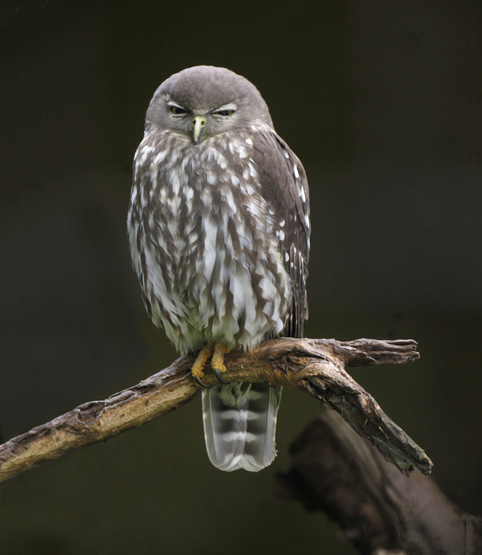
Barking owl
Barbara Hardy Institute
-01_fmt.jpeg)
Source: DEWNR (2013)
Figure 1 Native vegetation extent in South Australia
Illegal clearing continues to occur. Table 3 presents the number of reports alleging clearance of native vegetation by natural resource management (NRM) region for 2011–12 and the six preceding years (see the Introduction for information about NRM regions). The number of reports received for 2010–11 is above the average recorded over the seven years of collecting data.
2.1.2 Native vegetation condition
Human enterprise has had an impact on native vegetation throughout South Australia and much of it has been modified to some degree. However, it is difficult to quantify native vegetation condition systematically on a state scale. This is due to methodological and technical issues, and to inconsistent investment of effort in monitoring and evaluation in different South Australian regions.
There is currently no standard definition for the term ‘vegetation condition’, but it has continued to grow in importance with the implementation of NRM programs throughout Australia. A number of different vegetation condition assessment methods have been developed. In South Australia, the Bushland Condition Monitoring method has been applied since 2003 in different parts of the agricultural zone (NCSSA 2010).
The method focuses on ‘lead’ and ‘lag’ indicators to track changes in vegetation condition and how these relate to management of native vegetation (NCSSA 2010). Lead indicators represent attributes of vegetation that can change soon after management of disturbance or threat reduction, while lag indicators tend to change after some time has elapsed after management intervention (O’Connor et al. 2009) (Table 4).
|
Year |
Clearance applications (under section 28 of the Native Vegetation Act 1991) |
||||||||||||||||||||||||||||||||||||||||||||||||||||||||||||||||||||||||||||||||||||||||||||||||||
|---|---|---|---|---|---|---|---|---|---|---|---|---|---|---|---|---|---|---|---|---|---|---|---|---|---|---|---|---|---|---|---|---|---|---|---|---|---|---|---|---|---|---|---|---|---|---|---|---|---|---|---|---|---|---|---|---|---|---|---|---|---|---|---|---|---|---|---|---|---|---|---|---|---|---|---|---|---|---|---|---|---|---|---|---|---|---|---|---|---|---|---|---|---|---|---|---|---|---|---|
|
ha = hectare; n = number Source: Native Vegetation Council (2012) | |||||||||||||||||||||||||||||||||||||||||||||||||||||||||||||||||||||||||||||||||||||||||||||||||||
|
Degraded native vegetation |
Scrubland refused |
Individual trees |
Individual trees refused |
||||||||||||||||||||||||||||||||||||||||||||||||||||||||||||||||||||||||||||||||||||||||||||||||
|
2009–10 |
1074.24 |
356 |
|||||||||||||||||||||||||||||||||||||||||||||||||||||||||||||||||||||||||||||||||||||||||||||||||
|
2010–11 |
1107.09 |
135.57 |
334 |
47 |
|||||||||||||||||||||||||||||||||||||||||||||||||||||||||||||||||||||||||||||||||||||||||||||||
|
2011–12 |
1712.55 |
30.00 |
115 |
110 |
|||||||||||||||||||||||||||||||||||||||||||||||||||||||||||||||||||||||||||||||||||||||||||||||
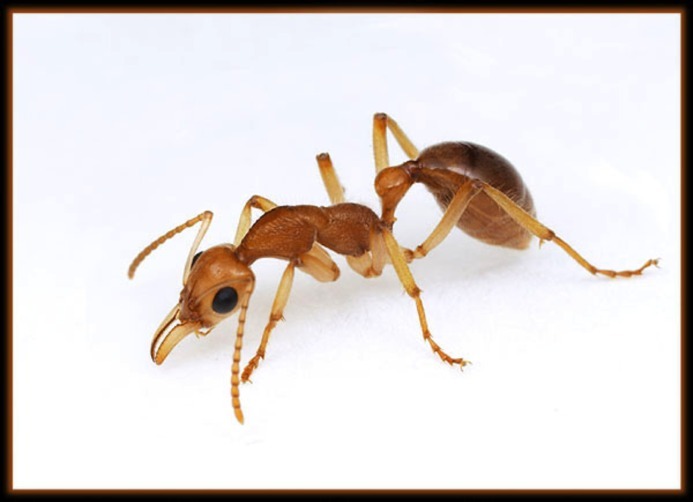
Nothomyrmecia
The dinosaur ant Nothomyrmecia macrops is a rare nocturnal ant found only in mallee habitat in South Australia. This predatory insect is very similar to a group of previously widespread but now extinct Cretaceous ants. The farm town of Poochera in South Australia (population 24) is perhaps the only place in the world with ant-based tourism. Nothomyrmecia was rediscovered here in the 1970s, and the area still attracts myrmecologists. The town has stencilled ants in various places along the public streets.
|
Region |
2004–05 |
2005–06 |
2006–07 |
2007–08 |
2008–09 |
2009–10 |
2010–11 |
2011-12 |
|||||||||||||||||||||||||||||||||||||||||||||||||||||||||||||||||||||||||||||||||||||||||||
|---|---|---|---|---|---|---|---|---|---|---|---|---|---|---|---|---|---|---|---|---|---|---|---|---|---|---|---|---|---|---|---|---|---|---|---|---|---|---|---|---|---|---|---|---|---|---|---|---|---|---|---|---|---|---|---|---|---|---|---|---|---|---|---|---|---|---|---|---|---|---|---|---|---|---|---|---|---|---|---|---|---|---|---|---|---|---|---|---|---|---|---|---|---|---|---|---|---|---|---|
|
a CDP uses satellite imagery to detect changes in native vegetation cover. Note: No clearing was recorded for the Alinytjara Wilurara region. Source: Native Vegetation Council (2012) | |||||||||||||||||||||||||||||||||||||||||||||||||||||||||||||||||||||||||||||||||||||||||||||||||||
|
Adelaide and Mount Lofty Ranges |
41 |
60 |
54 |
59 |
77 |
49 |
50 |
53 |
|||||||||||||||||||||||||||||||||||||||||||||||||||||||||||||||||||||||||||||||||||||||||||
|
Eyre Peninsula |
16 |
29 |
15 |
25 |
31 |
48 |
34 |
14 |
|||||||||||||||||||||||||||||||||||||||||||||||||||||||||||||||||||||||||||||||||||||||||||
|
Kangaroo Island |
14 |
27 |
12 |
4 |
10 |
18 |
14 |
15 |
|||||||||||||||||||||||||||||||||||||||||||||||||||||||||||||||||||||||||||||||||||||||||||
|
Northern and Yorke |
26 |
23 |
17 |
11 |
23 |
37 |
28 |
29 |
|||||||||||||||||||||||||||||||||||||||||||||||||||||||||||||||||||||||||||||||||||||||||||
|
South Australian Arid Lands |
9 |
6 |
8 |
2 |
2 |
1 |
1 |
1 |
|||||||||||||||||||||||||||||||||||||||||||||||||||||||||||||||||||||||||||||||||||||||||||
|
South Australian Murray–Darling Basin |
31 |
36 |
21 |
30 |
44 |
48 |
36 |
36 |
|||||||||||||||||||||||||||||||||||||||||||||||||||||||||||||||||||||||||||||||||||||||||||
|
South East |
26 |
48 |
31 |
30 |
36 |
54 |
48 |
33 |
|||||||||||||||||||||||||||||||||||||||||||||||||||||||||||||||||||||||||||||||||||||||||||
|
Change Detection Program (CDP)a |
50 |
||||||||||||||||||||||||||||||||||||||||||||||||||||||||||||||||||||||||||||||||||||||||||||||||||
|
Total |
163 |
229 |
158 |
161 |
223 |
255 |
211 |
231 |
|||||||||||||||||||||||||||||||||||||||||||||||||||||||||||||||||||||||||||||||||||||||||||
|
Lead indicators |
Lag indicators |
|---|---|
|
Feral animal impact Total grazing pressure Weed threat and abundance Fallen logs and trees |
Hollow trees Primary canopy health Recruitment of species Fallen logs and trees Plant species diversity Structural diversity A: ground cover Structural diversity B: plant life forms Lerp damage Mistletoe infestation |
The following case study (Box 1) examines vegetation condition data from 840 sites in three South Australian regions—Adelaide and Mount Lofty Ranges, Northern and Yorke, and part of the South Australian Murray–Darling Basin. The results provide a snapshot of vegetation condition in the three regions based on 11 of 12 Bushfire Condition Monitoring indicators.
The South Australian Pastoral Board is required to assess the condition of land in pastoral leases at intervals of not more than 14 years. The first round of assessments was completed in 2000 and a second round, begun in 2005, is due for completion in 2014. It is not possible to report any data analysis at this time, but the Pastoral Board reported on general trends in their 2010–11 annual report (Pastoral Board 2011). The report noted that extended dry periods over the 10 years to 2010 resulted in extensive losses of bladder saltbush, and no recruitment of the species had occurred, despite some heavy rainfall events in 2009. Positive responses to rainfall events were noted with high rates of production of ephemeral stockfeed and recruitment of many shrubs such as pearl bluebush and low bluebush. Areas that were affected by severe dust storms in 2009 were showing signs of recovery.
An emerging threat to vegetation in the pastoral zone is an expansion of mining exploration and operations; however, no comprehensive data were available at the time of writing.
2.2 Threatened species and ecological communities
Threatened species are those species deemed to be at risk of extinction within the foreseeable future, under certain International Union for Conservation of Nature (IUCN) risk assessment criteria (IUCN 2011). Different species have different levels of risk based on their biology and ecological requirements; geographic range; population size and numbers of populations; rates of range contraction and population decline; habitat quantity, quality and connectedness or isolation; and relative risks posed by threats such as predation, competition, fire and climate change.
Threatened ecological communities are threatened ‘geographically distinct assemblages of interacting native species and their associated abiotic environments’ (Bonifacio and Pisanu 2012). They are one of several ‘matters of national environmental significance’ listed under the Commonwealth’s Environment Protection and Biodiversity Conservation Act 1999 (EPBC Act). Threatened ecological communities are not generally recognised in South Australian law; however, there are provisions under the Native Vegetation Act 1991 that protect such communities where ‘the vegetation comprises the whole, or a part, of a plant community that is rare, vulnerable or endangered’.
The conservation status of species can be assessed at four levels:
- global—recognised through the IUCN Red List of Threatened Species (IUCN 2012)
- national—recognised through lists of species threatened within Australian, with lists linked to the EPBC Act
- state—recognised in South Australia through schedules of threatened species under the South Australian National Parks and Wildlife Act 1972 (NPW Act)
- regional—recognised in South Australia through priority lists in regional NRM plans.
In South Australia, the assessment of conservation status is undertaken at all four levels and uses the standardised IUCN assessment criteria:
- range of distribution
- area of habitat occupied
- number of populations
- number of individuals (measured, estimated)
- rate of population decline (measured, estimated).
As a result of these assessments, species are assigned to a standardised IUCN conservation status category of presumed extinct, critically endangered, endangered, vulnerable, near threatened or least concern. Although assessments in South Australia apply the standards described, the South Australian NPW Act has not yet been amended to use the contemporary IUCN categories. Instead, species that are assessed as presumed extinct, critically endangered or endangered are all included under the endangered species schedule (Schedule 7). Species assessed as vulnerable align with Schedule 8: vulnerable species. Species assessed as near threatened mostly align with Schedule 9: rare species.
South Australia’s Strategic Plan (Government of South Australia 2011) includes a target to ‘lose no native species as a result of human impacts’. The measure for this target is a set of 20 indicator species—threatened species that are representative of South Australia’s organisms and habitats, and where much effort is focused on their protection by organisations across the state. An assessment is made of trends in population abundance of each species, taking into account its population numbers, distribution, prevalence of native habitat, food sources, predators, etc. All species on the indicator list are reviewed annually (half of the list is assessed every six months). A summary of the most recent review is provided in Table 5.
Box 1 Case study: Vegetation condition in the South Australian agricultural zone
Vegetation condition is summarised for the Adelaide and Mount Lofty Ranges, Northern and Yorke, and South Australian Murray–Darling Basin natural resource management regions of South Australia, using data from 2011.
Positives
Plant species diversity remains reasonably high in the majority of sites, though an average of 25–30% of species has been lost from each site. Ground cover is relatively intact, and the abundance of fallen logs and trees is good or excellent in 40–70% of sites.
Negatives
Vegetation condition remains affected by grazing pressure; the most serious consequences are low recruitment of plant species and high weed threat and abundance. There is a low number of hollow trees in all regions, and low structural diversity in some regions. Tree health is poor because of dieback resulting from land management impacts.
The 2008 state of the environment report for South Australia (EPA 2008) reported the condition of native vegetation in the pastoral zone. Historically, livestock impacts have been prevalent around permanent water points, resulting in degradation of vegetation, soil disturbance and erosion. The condition of native vegetation varies from property to property, and impacts such as selective grazing by stock, grazing by feral herbivores and weeds continue.
|
Indicator |
AMLR (2009) |
NY (2011) |
SAMDB (2010) |
Summary of regions |
|||||||||||||||||||||||||||||||||||||||||||||||||||||||||||||||||||||||||||||||||||||||||||||||
|---|---|---|---|---|---|---|---|---|---|---|---|---|---|---|---|---|---|---|---|---|---|---|---|---|---|---|---|---|---|---|---|---|---|---|---|---|---|---|---|---|---|---|---|---|---|---|---|---|---|---|---|---|---|---|---|---|---|---|---|---|---|---|---|---|---|---|---|---|---|---|---|---|---|---|---|---|---|---|---|---|---|---|---|---|---|---|---|---|---|---|---|---|---|---|---|---|---|---|---|
|
AMLR = Adelaide and Mount Lofty Ranges; NY = Northern and Yorke; SAMBD = South Australian Murray–Darling Basin Notes:
Sources: O’Connor et al. (2009), NCSSA (2010), O’Connor NRM Pty Ltd (pers. comm, 2012) | |||||||||||||||||||||||||||||||||||||||||||||||||||||||||||||||||||||||||||||||||||||||||||||||||||
|
Plant species diversity |
69% of sites with good or excellent species diversity |
>75% of sites with moderate to good species diversity |
>70% of sites with good or excellent species diversity |
Species diversity generally good; however, the abundance of species may have changed, and rare or sensitive species may be lost |
|||||||||||||||||||||||||||||||||||||||||||||||||||||||||||||||||||||||||||||||||||||||||||||||
|
Recruitment of species |
Around 40% of sites with poor or very poor recruitment |
57% of sites with poor or very poor recruitment |
>35% of sites with poor or very poor recruitment |
Recruitment is generally poor to very poor, with lowest recruitment where domestic grazing is most prevalent. This probably relates to differences in land-use type and mixed farming models in different regions |
|||||||||||||||||||||||||||||||||||||||||||||||||||||||||||||||||||||||||||||||||||||||||||||||
|
Hollow trees |
69% of sites with poor numbers of hollow trees, with only 4% of sites classified as excellent |
Only 40% of sites with good or excellent numbers of hollow trees |
>75% of sites with very poor numbers of hollow trees |
Hollow tree numbers are very poor in all regions |
|||||||||||||||||||||||||||||||||||||||||||||||||||||||||||||||||||||||||||||||||||||||||||||||
|
Total grazing pressure |
91% of sites with excellent control of grazing pressure impacts |
60% of sites with either poor or very poor control of grazing pressure impacts, 25% with control of grazing pressure |
70% of sites with excellent control of grazing pressure impacts |
Grazing pressure impact is variable (high in NY and low–moderate in AMLR and SAMDB) and probably relates to differences in land-use type and mixed farming models in different regions |
|||||||||||||||||||||||||||||||||||||||||||||||||||||||||||||||||||||||||||||||||||||||||||||||
|
Weed threat and abundance |
Around 40% of sites with poor or very poor weed threat and abundance control |
75% of sites with poor or very poor weed threat and abundance control |
29% of sites with poor or very poor weed threat and abundance control |
Weed threat and abundance is high in NY and moderate in AMLR and SAMDB. This probably relates to differences in land-use type and mixed farming models in different regions |
|||||||||||||||||||||||||||||||||||||||||||||||||||||||||||||||||||||||||||||||||||||||||||||||
|
Fallen logs and trees |
Around 40% of sites with good or excellent abundance of fallen logs and trees |
70% of sites with good or excellent abundance of fallen logs and trees |
>55% of sites with good or excellent abundance of fallen logs and trees |
Retention of fallen logs and trees is generally good |
|||||||||||||||||||||||||||||||||||||||||||||||||||||||||||||||||||||||||||||||||||||||||||||||
|
Primary canopy health |
>70% of sites with moderate to very poor canopy health |
70% of sites with poor to very poor canopy health |
50% of sites with poor to very poor canopy health |
Canopy health is generally poor, probably because of dieback from soil compaction, fragmentation and competition with weed species |
|||||||||||||||||||||||||||||||||||||||||||||||||||||||||||||||||||||||||||||||||||||||||||||||
|
Ground cover |
>80% of sites with good or excellent ground cover |
90% of sites with moderate or good ground cover |
90% of sites with good or excellent ground cover |
Ground cover is generally good, with lower cover in NY than other regions, probably relating to differences in land-use type and mixed farming models in different regions |
|||||||||||||||||||||||||||||||||||||||||||||||||||||||||||||||||||||||||||||||||||||||||||||||
|
Plant life forms diversity |
77% of sites with moderate or good plant life form diversity |
24% of sites with good or excellent plant life form diversity |
>85% of sites with moderate or good plant life form diversity |
Plant life form diversity was generally good in AMLR and SAMDB, and poor in NY. This is probably because of differences in grazing impacts in the different regions |
|||||||||||||||||||||||||||||||||||||||||||||||||||||||||||||||||||||||||||||||||||||||||||||||
|
Lerp damage |
73% of sites with little or no lerp infestation |
80% of sites with little or no lerp infestation |
>75% of sites with little or no lerp infestation |
Lerp damage is isolated to some locations and some tree species |
|||||||||||||||||||||||||||||||||||||||||||||||||||||||||||||||||||||||||||||||||||||||||||||||
|
Mistletoe infestation |
All sites across the region had very low mistletoe infestation |
85% of sites with very low mistletoe infestation |
All sites across the region had very low mistletoe infestation |
Mistletoe infestation is isolated to some locations and some tree species |
|||||||||||||||||||||||||||||||||||||||||||||||||||||||||||||||||||||||||||||||||||||||||||||||
|
Positive |
Stable |
Negative |
Total number of species |
||||||||||||||||||||||||||||||||||||||||||||||||||||||||||||||||||||||||||||||||||||||||||||||||
|---|---|---|---|---|---|---|---|---|---|---|---|---|---|---|---|---|---|---|---|---|---|---|---|---|---|---|---|---|---|---|---|---|---|---|---|---|---|---|---|---|---|---|---|---|---|---|---|---|---|---|---|---|---|---|---|---|---|---|---|---|---|---|---|---|---|---|---|---|---|---|---|---|---|---|---|---|---|---|---|---|---|---|---|---|---|---|---|---|---|---|---|---|---|---|---|---|---|---|---|
|
Note: For some of the indicator species, negative trends were recorded in consecutive assessments, including for the Australian sea lion, southern bent-wing bat and black-eared miner. Progress reports for the Strategic Plan 2011 (SASP Audit Committee 2012) include assessments of the causes of these trends, which include bycatch, drought and habitat destruction by bushfire. Source: Government of South Australia (2007a) | |||||||||||||||||||||||||||||||||||||||||||||||||||||||||||||||||||||||||||||||||||||||||||||||||||
|
Mammals |
Southern right whale Yellow-footed rock-wallaby South Australian mainland tammar wallaby |
Southern brown bandicoot Southern bent-wing bat |
Australian sea lion |
6 |
|||||||||||||||||||||||||||||||||||||||||||||||||||||||||||||||||||||||||||||||||||||||||||||||
|
Fish |
Yarra pygmy perch Murray hardyhead |
2 |
|||||||||||||||||||||||||||||||||||||||||||||||||||||||||||||||||||||||||||||||||||||||||||||||||
|
Molluscs |
Giant Australian cuttlefish (upper Spencer Gulf population) |
1 |
|||||||||||||||||||||||||||||||||||||||||||||||||||||||||||||||||||||||||||||||||||||||||||||||||
|
Birds |
South Australian glossy black cockatoo |
South-east Australian red-tailed black cockatoo Black-eared miner |
Malleefowl Mount Lofty Ranges southern emu-wren |
5 |
|||||||||||||||||||||||||||||||||||||||||||||||||||||||||||||||||||||||||||||||||||||||||||||||
|
Reptiles |
Pygmy blue-tongue skink |
1 |
|||||||||||||||||||||||||||||||||||||||||||||||||||||||||||||||||||||||||||||||||||||||||||||||||
|
Plants |
Small-flowered daisy-bush Pin-lipped spider-orchid |
Hindmarsh greenhood White beauty spider-orchid Monarto mintbush |
5 |
||||||||||||||||||||||||||||||||||||||||||||||||||||||||||||||||||||||||||||||||||||||||||||||||
|
Total number of species |
6 |
8 |
6 |
20 |
|||||||||||||||||||||||||||||||||||||||||||||||||||||||||||||||||||||||||||||||||||||||||||||||
2.2.1 National lists of threatened species
The extinction rates and declines of Australia’s mammals and birds are well documented, as is the proportion of those extinctions that were South Australian species (e.g. Burbidge et al. 1988). Box 2 shows the nationally listed threatened species that have been recorded in South Australia.
Box 2 and Table 6 show that South Australia is a major centre of modern (last 200 years) species extinctions and ongoing threats to many surviving species. The high proportions of endangered, vulnerable and rare mammal and bird species still listed within the state may also reflect an ‘extinction debt’—where the future extinction of species is likely due to events in the past (Szabo et al. 2011)—which is still to reach full effect following habitat and population declines, fragmentations and isolation, and periodic random events such as fires and droughts.
There are proportionally more South Australian species of mammals, birds and freshwater fish in national lists of threatened species than other taxonomic groups (Figure 2).
Box 2 Nationally listed threatened species, as listed under the Commonwealth Environment Protection and Biodiversity Conservation Act 1999, that have been recorded in South Australia (as at April 2012)
Plants (115 listed)
Presumed extinct (1 listed)
- Senecio helichrysoides
Critically endangered (8 listed)
- Acanthocladium dockeri
- Caladenia intuta
- Cassinia tegulata
- Hibbertia tenuis
- Prasophyllum murfetii
- Pterostylis bryophila
- Thelymitra cyanapicata
- Veronica derwentiana subsp. homalodonta
Endangered (43 listed)
- Acacia cretacea
- Acacia enterocarpa
- Acacia pinguifolia
- Acacia spilleriana
- Acacia whibleyana
- Allocasuarina robusta
- Brachyscome muelleri
- Caladenia argocalla
- Caladenia audasii
- Caladenia behrii
- Caladenia colorata
- Caladenia conferta
- Caladenia gladiolata
- Caladenia hastata
- Caladenia lowanensis
- Caladenia macroclavia
- Caladenia richardsiorum
- Caladenia rigida
- Caladenia tensa
- Caladenia xanthochila
- Caladenia xantholeuca
- Dodonaea subglandulifera
- Eriocaulon australasicum
- Eriocaulon carsonii subsp. carsonii
- Eucalyptus paludicola
- Euphrasia collina subsp. muelleri
- Euphrasiacollina subsp osbornii
- Frankenia plicata
- Haloragis eyreana
- Lachnagrostis limitanea
- Leionema equestre
- Lepidium monoplocoides
- Olearia microdisca
- Prasophyllum frenchii
- Prasophyllum goldsackii
- Prasophyllum pruinosum
- Prostanthera eurybioides
- Pterostylis despectans
- Pterostylis lepida
- Pterostylis sp. Hale (R.Bates 21725)
- Pultenaea trichophylla
- Senecio behrianus
- Thelymitra epipactoides
Vulnerable (63 listed)
- Acacia araneosa
- Acacia carneorum
- Acacia glandulicarpa
- Acacia latzii
- Acacia menzelii
- Acacia pickardii
- Acacia praemorsa
- Acacia rhetinocarpa
- Asterolasia phebalioides
- Beyeria subtecta
- Caladenia brumalis
- Caladenia calcicola
- Caladenia concolor
- Caladenia formosa
- Caladenia ovata
- Caladenia versicolor
- Caladenia woolcockiorum
- Cheiranthera volubilis
- Codonocarpus pyramidalis
- Correa calycina var. calycina
- Correa calycina var. halmaturorum
- Corybas dentatus
- Dodonaea procumbens
- Eleocharis papillosa
- Glycine latrobeana
- Grevillea treueriana
- Hibbertia crispula
- Ixodia achilleoides subsp. arenicola
- Lepidium pseudopapillosum
- Limosella granitica
- Logania insularis
- Microlepidium alatum
- Olearia pannosa subsp. pannosa
- Phebalium lowanense
- Pleuropappus phyllocalymmeus
- Pomaderris halmaturina subsp. halmaturina
- Prasophyllum pallidum
- Prasophyllum spicatum
- Prasophyllum validum
- Prostanthera calycina
- Prostanthera nudula
- Pterostylis arenicola
- Pterostylis chlorogramma
- Pterostylis cucullata subsp. cucullata
- Pterostylis cucullata subsp. sylvicola
- Pterostylis mirabilis
- Pterostylis tenuissima
- Pterostylis xerophila
- Ptilotus beckerianus
- Pultenaea villifera var. glabrescens
- Senecio macrocarpus
- Senecio megaglossus
- Senecio psilocarpus
- Solanum karsense
- Spyridium coactilifolium
- Spyridium eriocephalum var. glabrisepalum
- Stackhousia annua
- Swainsona murrayana
- Swainsona pyrophila
- Taraxacum cygnorum
- Tecticornia flabelliformis
- Thelymitra matthewsii
- Xerothamnella parvifolia
Animals
Amphibians (1 listed)
Vulnerable (1 listed)
- Litoria raniformis Southern bell frog
Birds (39 listed)
Presumed extinct (1 listed)
- Dromaius baudinianus Kangaroo Island emu
Critically endangered (2 listed)
- Cinclosoma punctatum anachoreta
Spotted quail-thrush (Mount Lofty Ranges subsp.) - Neophema chrysogaster
Orange-bellied parrot
Endangered (15 listed)
- Anthochaera phrygia
Regent honeyeater - Botaurus poiciloptilus
Australasian bittern - Calyptorhynchus banksii graptogyne
Red-tailed black cockatoo (south-eastern subsp.) - Calyptorhynchus lathami halmaturinusGlossy black cockatoo (South Australian subsp.)
- Diomedea epomophora sanfordi
Northern royal albatross - Diomedea exulans amsterdamensis
Amsterdam albatross - Diomedea exulans exulans
Tristan albatross - Hylacola pyrrhopygia parkeri
Chestnut-rumped heathwren (Mount Lofty Ranges subsp.) - Lathamus discolor
Swift parrot - Macronectes giganteus
Southern giant-petrel - Manorina melanotis
Black-eared miner - Pezoporus occidentalis
Night parrot - Stipiturus malachurus intermedius
Southern emu-wren (Mount Lofty Ranges subsp.) - Stipiturus mallee
Mallee emu-wren - Thalassarche chrysostoma
Grey-headed albatross
Vulnerable (21 listed)
- Acanthiza iredalei iredalei
Slender-billed thornbill (western subsp.) - Amytornis barbatus barbatus
Grey grasswren - Amytornis modestus
Thick-billed grasswren -
Diomedea epomophora epomophora
Southern royal albatross - Halobaena caerulea
Blue petrel - Leipoa ocellata
Malleefowl - Macronectes halli
Northern giant-petrel - Pachycephala rufogularis
Red-lored whistler - Pedionomus torquatus
Plains wanderer - Phoebetria fusca
Sooty albatross - Polytelis alexandrae
Princess parrot - Polytelis anthopeplus monarchoides
Eastern regent parrot - Psophodes nigrogularis leucogaster
Western whipbird (eastern subsp.) - Pterodroma mollis
Soft-plumaged petrel - Rostratula australis
Australian painted snipe - Stipiturus malachurus parimeda
Southern emu-wren (Eyre Peninsula subsp.) - Thalassarche bulleri
Buller’s albatross - Thalassarche cauta cauta
Shy albatross - Thalassarche cauta salvini
Salvin’s albatross - Thalassarche melanophris
Black-browed albatross - Thalassarche melanophris impavida
Campbell albatross
Fish (10 listed)
Endangered (3 listed)
- Craterocephalus fluviatilis
Murray hardyhead - Maccullochella macquariensis
Trout cod - Macquaria australasica
Macquarie perch
Vulnerable (7 listed)
- Galaxiella pusilla
Dwarf galaxias - Maccullochella peelii peelii
Murray cod - Mogurnda clivicola
Flinders Ranges purple-spotted gudgeon - Nannoperca obscura
Yarra pygmy perch - Nannoperca variegata
Ewen’s pygmy perch - Prototroctes maraena
Australian grayling - Carcharodon carcharias
Great white shark
Invertebrates (2 listed)
Critically endangered (1 listed)
- Synemon plana
Golden sun moth
Endangered (1 listed)
- Euastacus bispinosus
Glenelg spiny freshwater crayfish
Mammals (52 listed)
Presumed extinct (17 listed)
- Bettongia lesueur graii
Burrowing bettong (boodie) - Bettongia penicillata penicillata
Brush-tailed bettong - Caloprymnus campestris
Desert rat-kangaroo - Chaeropus ecaudatus
Pig-footed bandicoot - Conilurus albipes
White-footed rabbit-rat - Lagorchestes hirsutus hirsutus
Mala (rufous hare-wallaby) - Lagorchestes leporides
Eastern hare-wallaby - Leporillus apicalis
Lesser stick-nest rat - Macropus eugenii eugenii
Tammar wallaby (South Australia) - Macropus greyi
Toolache wallaby - Macrotis leucura
Lesser bilby - Notomys amplus
Short-tailed hopping mouse - Notomys longicaudatus
Long-tailed hopping mouse - Onychogalea lunata
Crescent nail-tailed wallaby - Perameles bougainville fasciata
Western barred bandicoot (mainland) - Perameles eremiana
Desert bandicoot - Pseudomys gouldii
Gould’s mouse
Critically endangered (1 listed)
- Miniopterus schreibersii bassanii
Southern bent-wing bat
Endangered (11 listed)
- Balaenoptera musculus
Blue whale - Bettongia penicillata ogilbyi
Brush-tailed bettong - Dasycercus hillieri
Mulgara - Dasyurus maculatus maculatus
Spotted-tailed quoll (south-eastern mainland population) - Eubalaena australis
Southern right whale - Isoodon obesulus obesulus
Southern brown bandicoot - Notoryctes typhlops
Marsupial mole (itjari-tjari) - Perameles gunnii unnamed subsp.
Eastern barred bandicoot (mainland) - Phascogale calura
Red-tailed phascogale - Sminthopsis aitkeni
Sooty dunnart (Kangaroo Island dunnart) - Sminthopsis psammophila
Sandhill dunnart
Vulnerable (23 listed)
- Arctocephalus tropicalis
Subantarctic fur seal - Balaenoptera borealis
Sei whale - Balaenoptera physalus
Fin whale - Dasycercus cristicauda
Ampurta - Dasyuroides byrnei
Kowari - Dasyurus geoffroii
Western quoll - Isoodon auratus auratus
Golden bandicoot - Isoodon obesulus nauticus
Southern brown bandicoot (Nuyts Island subsp.) - Leporillus conditor
Greater stick-nest rat - Macrotis lagotis
Greater bilby - Megaptera novaeangliae
Humpback whale - Mirounga leonina
Southern elephant seal - Myrmecobius fasciatus
Numbat - Neophoca cinerea
Australian sea lion - Notomys fuscus
Dusky hopping mouse - Nyctophilus corbeni
South-eastern long-eared bat - Petrogale lateralis
Black-footed rock-wallaby (McDonnell Ranges race) - Petrogale xanthopus xanthopus
Yellow-footed rock-wallaby - Potorous tridactylus tridactylus
Long-nosed potoroo - Pseudomys australis
Plains mouse (Plains rat) - Pseudomys fieldi
Shark Bay mouse - Pseudomys shortridgei
Heath rat - Pteropus poliocephalus
Grey-headed flying fox
Reptiles (9 listed)
Endangered (3 listed)
- Caretta caretta
Loggerhead turtle - Dermochelys coriacea
Leathery turtle - Tiliqua adelaidensis
Pygmy blue-tongue skink
Vulnerable (6 listed)
- Aprasia pseudopulchella
Flinders worm-lizard - Chelonia mydas
Green turtle - Delma impar
Striped snake-lizard - Liopholis kintorei
Tjakura - Notechis scutatus ater
Krefft’s tiger snake - Ophidiocephalus taeniatus
Bronzeback legless lizard
-01_fmt.jpeg)
Figure 2 Proportions of nationally listed threatened species recorded in South Australia by taxonomic group, April 2012
Since the last South Australian state of the environment report in 2008 (EPA 2008), 14 species that occur in South Australia have been added to the lists under the EPBC Act:
- nine plant species: five critically endangered (Caladenia intuta, Cassinia tegulata, Hibbertia tenuis, Thelymitra cyanapicata and Veronica derwentiana subsp. homalodonta), three endangered (Acacia spilleriana, Prasophyllum pruinosum and Pultenaea trichophylla) and one vulnerable (Acacia praemorsa)
- four bird species: three endangered (Australasian bittern, mallee emu-wren and grey-headed albatross) and one vulnerable (fairy tern)
- one freshwater crustacean: the endangered Glenelg spiny freshwater crayfish. This freshwater crayfish has also been added to the list of protected species under the South Australian Fisheries Management Act 2007.
Over the same period, three vulnerable plant species (Austrostipa nullanulla, Acacia imbricata and Basedowia tenerrima), one vulnerable mammal species (Pearson Island rock-wallaby), one vulnerable reptile (Pernatty knob-tail gecko) and one vulnerable bird species (Gawler Ranges thick-billed grasswren) have been de-listed from the EPBC Act list of threatened species. A further 14 South Australian taxa have also been recommended for removal from the national list of threatened birds. These recommendations are primarily due to better knowledge of distributions, population sizes or degrees of threat and, for some, because new criteria have been used to define near threatened. None has yet been removed because of recovery (see Section 4.2).
Birds
The continuing decline of Australia’s bird species has underpinned a revision of the EPBC Act list of threatened species in The action plan for Australian birds 2010 (Garnett et al. 2011). This follows earlier action plans for Australian birds (1990 and 2000). The 2010 action plan recommends new listings for 19 species or subspecies that breed in South Australia. Eight of these were already listed but are now assessed to be in a worse status category than 10 years earlier. Eleven others are listed in a threat category for the first time, including six because of recent taxonomic recognition of new subspecies of grass-wrens. The list also includes at least 14 threatened oceanic seabirds that do not breed in South Australia, but use South Australian waters. It also includes an assessment of non-breeding migratory waders for the first time, and 15 taxa assessed as threatened visit South Australian mudflats and shorelines on a regular basis.
As a follow-up analysis to the three decadal action plans for Australian birds, Szabo et al. (2012) demonstrate that South Australia has the second-worst IUCN Red List indices of species survival for continental birds of all Australian states and territories, excluding status changes driven by threats operating outside of Australia. However, their analyses also suggest that, if conservation actions had not been in place over the past decade or more, eight listed threatened bird species that occur in South Australia would now be listed (or recommended for listing) in a worse conservation status category (Szabo et al. 2102).
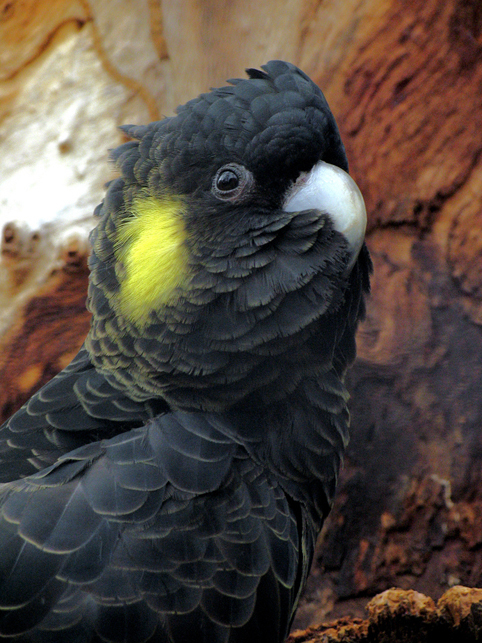
Yellow-tailed black cockatoo
Barbara Hardy Institute
Fish
The plight of many fish species that depend on our inland waters has come to the fore relatively recently (e.g. Hammer et al. 2009) and, as Figure 2 indicates, fish species that occur in South Australia appear to be overrepresented in the lists of those that are declining (25% of native freshwater fish species listed nationally are found in South Australia). In addition, three commercially exploited fishes that occur in South Australia—school shark, orange roughy and southern bluefin tuna—have been added to a different EPBC Act list of ‘conservation dependent’ species, acknowledging that their conservation status needs to be recognised nationally and their populations carefully managed through sustainable fisheries management practices.
2.2.2 South Australian lists of threatened species
Table 6 lists the numbers of threatened plant and vertebrate animals in South Australia as listed under Schedules 7, 8 and 9 (Threatened Species Schedules) of the NPW Act.
The threatened species schedules that Table 6 is based on have not been revised since the 2008 state of the environment report was published. This is not a reflection on actual changes in the status of threatened species in South Australia. It is primarily because revisions to the schedules require a complex legal process for gazetting, which has meant that rather than one, two, or a few species being added to, deleted from, or changed between schedules, the entire schedules are revised periodically.
Freshwater fish
Status assessments undertaken as a basis for the Action Plan for South Australia’s Freshwater Fishes (Hammer et al. 2009) have indicated that, at the state level, there are three species of freshwater fish presumed to be extinct, eight that should be listed as critically endangered, nine as endangered, nine as vulnerable and three as rare (or near threatened). Only 26 species (45%) were considered secure enough to not be recommended for listing.
Several of the small-bodied threatened fish species identified in the action plan have been added to the lists of aquatic species that are protected under the Fisheries Management Act 2007. All species await reassessment in light of much more information now being available. Amendments will need to be made to the NPW Act before any of them can be added to the South Australian Threatened Species Schedules.
|
Status under the National Parks (No. of South Australian native species) |
Plants (5858) |
Mammals (180) |
Birds (473) |
Reptiles (235) |
Amphibians (27) |
||||||||||||||||||||||||||||||||||||||||||||||||||||||||||||||||||||||||||||||||||||||||||||||
|---|---|---|---|---|---|---|---|---|---|---|---|---|---|---|---|---|---|---|---|---|---|---|---|---|---|---|---|---|---|---|---|---|---|---|---|---|---|---|---|---|---|---|---|---|---|---|---|---|---|---|---|---|---|---|---|---|---|---|---|---|---|---|---|---|---|---|---|---|---|---|---|---|---|---|---|---|---|---|---|---|---|---|---|---|---|---|---|---|---|---|---|---|---|---|---|---|---|---|---|
Note: The total number of native species within each taxonomic group used to calculate the percentage in each threat category is the same as used in the 2008 state of the environment report. Fish are not included in the table because they are not listed under the National Parks and Wildlife Act 1972. | |||||||||||||||||||||||||||||||||||||||||||||||||||||||||||||||||||||||||||||||||||||||||||||||||||
|
Critically endangered and endangered (%) |
161a (3) |
21b (26) |
34c (7) |
9 (4) |
0 (0) |
||||||||||||||||||||||||||||||||||||||||||||||||||||||||||||||||||||||||||||||||||||||||||||||
|
Vulnerable (%) |
196 (3) |
21 (12) |
32 (7) |
9 (4) |
4 (15) |
||||||||||||||||||||||||||||||||||||||||||||||||||||||||||||||||||||||||||||||||||||||||||||||
|
Rare (%) |
431 (7) |
32 (18) |
89 (19) |
35 (15) |
4 (15) |
||||||||||||||||||||||||||||||||||||||||||||||||||||||||||||||||||||||||||||||||||||||||||||||
|
Total (%) |
788 (14) |
74 (56) |
155 (33) |
53 (23) |
8 (30) |
||||||||||||||||||||||||||||||||||||||||||||||||||||||||||||||||||||||||||||||||||||||||||||||
2.2.3 National lists of threatened ecological communities
Six ecological communities that occur in South Australia are currently listed as threatened under the EPBC Act. These are:
- critically endangered
- iron grass natural temperate grassland of South Australia
- peppermint box (Eucalyptus odorata) grassy woodland of South Australia
- swamps of the Fleurieu Peninsula
- endangered
- buloke woodlands of the Riverina and Murray–Darling Depression bioregions
- grey box (Eucalyptus microcarpa) grassy woodlands and derived native grasslands of
south-eastern Australia - the community of native species that depend on natural discharge of groundwater from the Great Artesian Basin.
An additional two ecological communities in South Australia have been nominated for listing:
- lower Murray River and associated wetlands, floodplains and groundwater systems from the junction of the Darling River to the sea
- Kangaroo Island narrow-leaf mallee communities.