2 What do we know about it?
Most of the indicators of the relationship between South Australians and their natural environment have remained stable since the 2008 South Australian state of the environment report (EPA 2008). There was a modest increase in the rate of population growth and related urban and regional development. Trends in public and private transport behaviour were stable, as were trends in air quality and water quality. Waste generation increased markedly, but so did the rate of recycling.
2.1 Population trends
The estimated resident population (ERP) of South Australia in June 2006 was 1.57 million. Comparison with the preliminary census rebased ERP of 1.64 million in June 2011 (ABS 2012a) indicates a population increase of 70 300 over the period, equivalent to an annual rate of increase of 0.88%. This represents an average annual increase of 14 070 people—significantly above the average annual increase of 11 230 (0.73% per year) between 2001 and 2006—and is the highest since the early 1970s. Overseas immigration was the most important driver of this accelerated rate, accounting for more than 70% of the growth.
This growth estimate is significantly lower than the estimated population increase of 88 400 (an average annual growth rate of 1.1%) based on the intercensal component of growth estimates. The Australian Bureau of Statistics (ABS) recommends (ABS 2012abc) that this figure should be used to estimate intercensal growth before the final census-based ERPs for 2011 and earlier censuses are released in June 2013. Comparisons of growth rates within this report are made to the first, more conservative, figure (0.88%).
Despite the relatively rapid population growth between 2006 and 2011, South Australia’s share of the Australian population has decreased consistently, from 9.4% in 1966 to 7.3% in 2011. This means that population growth has been more modest in South Australia than in most other states and territories.
Estimates of growth components (ABS 2012a) reveal that net overseas migration contributed approximately 71 200 people to the state’s growth, and natural increase (births minus deaths) contributed another 35 700 people. However, between 2006 and 2011 South Australia experienced a net loss of 18 400 residents to interstate destinations. An increase in the fertility rate since 2001 boosted the number of 0–4 year olds in the population in 2011, but losses through net migration interstate reduced the number of young adults in South Australia, although there is some evidence of return migration of adults in their thirties (G Hugo, University of Adelaide, pers. comm., 1 November 2012). A major increase in net overseas migration—from an annual net intake of 4300 in 2003–04 to a peak of 17 980 in 2008–09—was the dominant factor in the state’s population increase. Much of this increase was driven by an upsurge in long-term temporary migration, particularly of overseas students, but because many of these return to their home countries on completion of their studies, their long-term contribution to the migration stock is not as large as their net flow numbers suggest. It has been estimated that 15–20% of Adelaide City’s population comprises overseas students (G Hugo, University of Adelaide, pers. comm., 1 November 2012).
Over the last decade, South Australia’s population has continued to age (Table 1). In 2001, 19.3% of the state’s population was less than 15 years old and by 2011 this proportion had decreased to 17.7%. The proportion of persons of working age (15–64 years) increased slightly from 66.1% in 2001 to 66.4% by 2011, but the proportion of people aged 65 or over increased from 14.6% in 2001 to 15.9% in 2011, equivalent to an absolute increase of 39 600 people over the decade. It is projected that the number of people in Greater Adelaide aged over 65 will increase from 194 000 in 2006 to 407 000 in 2036 (a 110% increase). The projected continued ageing of the state’s population, and particularly a projected tripling of the size of the 85+ age group from 31 000 in 2006 to 98 000 in 2036 (Government of South Australia 2010), will demand specialised support services and appropriate amenities in housing, health and public transport. This increased demand on government may be partly offset by a trend for the younger elderly (aged 65–74 years) to take advantage of improvement in their general health to remain longer in the workforce.
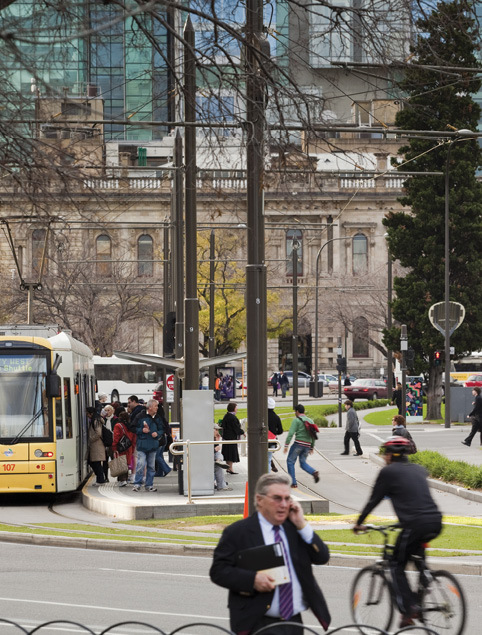
Tram stop at Victoria Square, Adelaide
Department of Planning, Transport and Infrastructure
|
Age group (years) |
2001 |
2006 |
2011 |
||||||||||||||||||||||||||||||||||||||||||||||||||||||||||||||||||||||||||||||||||||||||||||||||
|---|---|---|---|---|---|---|---|---|---|---|---|---|---|---|---|---|---|---|---|---|---|---|---|---|---|---|---|---|---|---|---|---|---|---|---|---|---|---|---|---|---|---|---|---|---|---|---|---|---|---|---|---|---|---|---|---|---|---|---|---|---|---|---|---|---|---|---|---|---|---|---|---|---|---|---|---|---|---|---|---|---|---|---|---|---|---|---|---|---|---|---|---|---|---|---|---|---|---|---|
|
Source: ABS (2012d) | |||||||||||||||||||||||||||||||||||||||||||||||||||||||||||||||||||||||||||||||||||||||||||||||||||
|
No. people |
% |
No. people |
% |
No. people |
% |
||||||||||||||||||||||||||||||||||||||||||||||||||||||||||||||||||||||||||||||||||||||||||||||
|
0–14 |
291 687 |
19.3 |
287 287 |
18.3 |
289 166 |
17.7 |
|||||||||||||||||||||||||||||||||||||||||||||||||||||||||||||||||||||||||||||||||||||||||||||
|
15–64 |
999 041 |
66.1 |
1 044 040 |
66.6 |
1 088 480 |
66.4 |
|||||||||||||||||||||||||||||||||||||||||||||||||||||||||||||||||||||||||||||||||||||||||||||
|
65+ |
221 000 |
14.6 |
236 561 |
15.1 |
260 586 |
15.9 |
|||||||||||||||||||||||||||||||||||||||||||||||||||||||||||||||||||||||||||||||||||||||||||||
|
Total |
1 511 728 |
100.0 |
1 567 888 |
100.0 |
1 638 232 |
100.0 |
|||||||||||||||||||||||||||||||||||||||||||||||||||||||||||||||||||||||||||||||||||||||||||||
2.2 Urban population change and development
Adelaide and its surrounding areas continue to show a high rate of population growth, while holiday and retirement homes are an increasing feature of coastal areas.
2.2.1 Adelaide
The growth of the Greater Adelaide region and the accompanying increase in employment has been the major driver of urban development in South Australia in 2006–11. Adelaide Statistical Division (ABS 2005) has experienced the largest population growth of 59 000, which is 80% of the state’s growth over 2006–11 (ABS 2012e). This growth has been accommodated by several major urban infill projects, ongoing demolition and redevelopment of the existing housing stock, plus large developments on the northern and southern fringes of the statistical division. Adelaide Statistical Division accounted for 73% of the state’s population in 2011, and its average annual growth rate of 1.0% over 2006–11 is similar to the state’s average annual growth rate of 0.9%.
With the release of the 2011 census, the ABS adopted a new geographical classification termed the Australian Statistical Geography Standard (ASGS). Under this classification, statistical divisions and statistical local areas have been abolished and a new greater capital city statistical area has been defined to identify the functional areas of the state capital cities. In the case of Adelaide, this is known as the Adelaide Greater Capital City Statistical Area, or Greater Adelaide. In 2011 the ERP of Greater Adelaide was 1 262 940, some 5.3% larger than Greater Adelaide’s ERP in 2006 of 1 199 605 (2011 ASGS boundaries), and equivalent to an average annual growth rate of 1.03% per year between 2006 and 2011. Given current uncertainty about the census rebasing of the ERP totals between 2006 and 2011 (ABS 2012b,c), growth estimates between the 2001 and 2011 censuses are perhaps a more reliable indication of recent growth. In the decade between the censuses of 2001 and 2011, the population of Greater Adelaide grew from 1 154 742 to 1 262 940—an increase of 108 198 people, or 10 819 people per year, and an average annual growth rate of 0.9% (Table 2).
The Outer Adelaide Statistical Division has absorbed an increased population of 10 000 over 2006–11 (14% of the state’s population growth). Its proximity to Adelaide and the availability of land led to an average annual rate of population growth in this division of 1.5% between 2006 and 2011—the most rapid rate of population increase of all the state statistical divisions and substantially higher than the state’s annual rate of population growth of 0.9%. As this division includes a large share of the state’s most productive agricultural land and critical water catchment areas, this growth has placed considerable pressure on infrastructure and services to meet the increased demands, and may have increased impact on the environment.
The 30-Year Plan for Greater Adelaide (30-Year Plan; DPLG 2010b) projected that the population of the Greater Adelaide planning region (comprising a larger area than the ABS definition of Greater Adelaide) will increase from 1.29 million in 2006 to 1.85 million people by 2036.
2.2.2 Housing
The demand for housing, as measured by the number of private dwellings, has increased more rapidly than the population since 1976 (Figure 1). This has been caused by population ageing, increased rates of family dissolution and generally good economic times that increased the demand for dwellings and reduced the size of households. Since the 1996 census, the rate of decrease in the number of people per private dwelling in the Greater Adelaide planning region has slowed (Figure 1), with decreased affordability of housing possibly being a factor in 2001–11 (G Hugo, University of Adelaide, pers. comm., 1 November 2012). When overseas visitors are excluded from the analysis, the average household size at the national level shows a very small increase from 2.532 to 2.537 people per household (defined as people in private dwellings) between 2006 and 2011 (idblog 2013), the first halt in the decline since the baby boom of the 1950s. In South Australia as a whole, the very slow downward trend continued from 2.386 to 2.383 people per household from 2006 to 2011, due to the ageing of South Australia’s population. Single-person households have been the fastest growing household type in South Australia during the last 10 years.
-01_fmt.jpeg)
ERP = estimated resident population
Notes:
- Because of the lack of comparable information on the number of people per private dwelling (occupied and unoccupied) before 1986, the population estimate used is the ERP divided by the total number of private dwellings.
- The recent decrease in people per dwelling may be underestimated because of an increase in the proportion of overseas students included in the ERP since 2006, and because most overseas students do not reside in private dwellings.
- The Greater Adelaide region (as defined in the 30-Year Plan) includes the Adelaide metropolitan area, the Outer Adelaide Statistical Division (except for Kangaroo Island) and the Rural City of Murray Bridge.
Sources: Australian Bureau of Statistics selected census ERP tabulations 1976 to 2011, ABS (2012e)
Figure 1 Comparison of growth in population and private dwellings, Greater Adelaide Region, 1976–2011
Analysis of the floor area of detached dwellings (Figure 2) shows that, until 2006, rising incomes and aspirations were reflected in a consistent increase in the proportion of detached dwellings with large floor areas (more than 300 square metres). Large houses use more energy to heat and cool, and more materials and energy to construct and eventually demolish, and thus have a large influence on the environmental footprint of a city. However, since 2006 this trend has reversed slightly, with the proportion of detached dwellings with floor areas greater than 300 square metres declining from 7.8% in 2006 to 7.6% in 2011. The median floor area of detached dwellings increased rapidly from 1986 to 2001, but has since declined modestly from a peak of 181 square metres in 2001 to 176 square metres in 2011. It is likely that increased energy prices, more demanding building code requirements (including a six star energy efficiency rating) and smaller lot sizes may be dampening the demand for houses with large floor areas.
-01_fmt.jpeg)
Note: The data exclude Kangaroo Island.
Source: June 2012 property cadastre and valuation snapshot, Department of Planning, Transport and Infrastructure, unpublished
Figure 2 Floor area of detached dwellings by year of completion, Adelaide and Outer Adelaide Statistical Divisions, 1986–2011
2.2.3 Urban expansion
Historically, a large proportion of new housing in South Australia has occurred on cheaper land on the fringe of the established metropolitan area, encroaching onto land that may have been better suited to primary production, or into natural areas, leading to an alteration of the natural environment, including a loss of biodiversity. This type of development increases the heat island effect (where cities are hotter than the surrounding rural areas), increases demand for energy and water, and increases the cost of providing transport and other infrastructure. Most importantly, broadhectare development is usually located some distance from the workplaces of most of its residents and on sites that are (at least initially) poorly served by public transport. Therefore, it generates an increase in car use, which leads to an increase in greenhouse gas emissions.
Figure 3 shows the historical spread of urban development in Adelaide. It shows the contrast between the compact spatial extent of the city for the first century of its development and the sprawl of the city after World War 2. This spread was particularly rapid during 1960–89, as a result of increased car ownership and rapid post-war population growth. In the two decades since, residential development has been slower and more spatially constrained. It is the intention of the 30-Year Plan to constrain the next 25 years of residential development within the 2038 boundaries identified in Figure 3.
2.2.4 Other urban centres
Many of the population trends for urban centres identified in the 2008 South Australian state of the environment report (EPA 2008) are still evident (Figure 4). For example, the urban centres with the highest rates of population growth between 2006 and 2011 are those either on the fringes of the Greater Adelaide Capital City Region (such as Mount Barker, Nairne, Hahndorf, Gawler and Angle Vale) or those just outside the Greater Adelaide Capital City Region but within easy commuting distance (such as Murray Bridge, Victor Harbor–Goolwa and Strathalbyn), and Nuriootpa in the Barossa Valley. There has also been significant growth of mining centres such as Roxby Downs, and a low rate of growth in major urban centres that service those developments, such as Whyalla and Port Augusta. Growth in these centres will likely slow with the delay in the Olympic Dam expansion. The major regional centre of Mount Gambier has experienced significant growth.
The populations of coastal towns such as Moonta, Victor Harbor–Goolwa and Normanville have continued to be boosted by retirement migration (mainly from Adelaide but also from rural areas in the hinterland) and the construction of holiday homes. Many coastal settlements in the state experienced a more rapid increase in unoccupied rather than occupied private dwellings between 2006 and 2011. This is indirect evidence of an increase in holiday homes and future retirement homes.
At the 2011 census, the coastal local government areas of Robe, Yorke Peninsula, Yankalilla, Barunga West and Elliston each had more than 40% of their private dwellings categorised as unoccupied, and Mid Murray District Council, with its attractive riverside sites, had 42% of its private dwellings unoccupied (ABS 2011). All-of-state analysis of population change in coastal local government areas in 2001–06 and 2006–11 indicates that, despite the total population growth rate accelerating from 0.7% to 0.9% per year, the average annual rate of growth in ERP of coastal local government areas (defined as outside the greater capital city statistical areas that border the coastline) halved from 1.0% to 0.5% per year between 2001–06 and 2006–11 (idblog 2012). Population growth is still strong on the Fleurieu Peninsula and on the Copper Coast, but has slowed in many small centres on Eyre and Yorke peninsulas.
There has also been a noticeable decrease in the population of towns serving dryland farming areas such as Bordertown, Keith and Peterborough, and a similar decrease of population in several Riverland centres such as Berri and Loxton, related to the decreased availability of irrigation flows during the drought years from 1998 to 2010. Local reports from the Riverland region (ABC 2012) indicate that low fruit prices, high input costs (especially for electricity) and lingering debt have combined to force as many as 300 local residents to temporarily move out of the region to take part in fly-in fly-out mining industry work each year. Mining industry–related work offers steady salaries, predictable shift work and a stable income that is difficult to obtain from farm work alone. Although it is hoped that the short-term economic fix from mining will allow farmers to remain residents of the Riverland, many of the smaller blocks of land are marginally economically sustainable, suggesting that there may be long-term depopulation of the Riverland’s farm and town populations.
_fmt.jpeg)
Source: Valuation data supplied by the Department of Planning, Transport and Infrastructure
Figure 3 Residential development of Adelaide and environs, pre-1910–2011, and planned development areas to 2038
-01_fmt.jpeg)
Source: ABS (2012f)
Figure 4 Estimated resident population of urban centres, 2011, and average annual change in estimated resident population, 2006–11
2.2.5 Liveability
Adelaide ranked ninth among 140 world cities on the 2012 Economist Intelligence Unit’s liveability index and retained its place as the most liveable Australian city according to the Australian City Liveability Index. In 2012, Adelaide hosted 7.5 million international visitor nights, up from 5.7 million in 2008, but saw a drop in domestic visitor nights from 8.1 million in 2008 to 7.2 million in 2012 (DIT 2012a).
2.3 Regional population change and development
The regional pattern of population change over 2006–11 is summarised in Table 2 and Figure 5. Apart from the Adelaide and Outer Adelaide statistical divisions (see Section 2.2.1), population growth in the other divisions since 2006 has been relatively minor at 1000 people or less over the five years. Indeed, both South East and Murray Lands statistical divisions have experienced minor population declines, largely because of ABS adjustments.
Like Victor Harbor in the Outer Adelaide Statistical Division, the Yorke and Lower North Statistical Division (particularly the Copper Coast) has been the recipient of retirement migration from other parts of the state. This has resulted in the third highest annual growth rate between 2006 and 2011 of 0.45%, and the oldest population in the state. Eyre and Northern statistical divisions witnessed modest rates of population increase (0.2% compared with 0.9% per year for the state) as a result of the development of mineral resources and an increased demand for labour.
2.3.1 Local area population change
Spatial differences in population change are most pronounced, and environmental impacts are likely to be most evident, at the larger scale of the statistical local area (SLA) and local government area (LGA). Figures 6 and 7 show the spatial patterns of population change at the SLA level, the total absolute change over 2006–11 and the average annual percentage change.
Substantial absolute increases in population have the potential to significantly affect the natural environment. The largest absolute increases over 2006–11 occurred in the SLAs on the southern and northern edges of the Adelaide metropolitan area: increases of 7860 in Onkaparinga–South Coast, 7530 in Salisbury Balance, 3850 in Playford–West and 3250 in Playford–West Central. As these population increases were generally on new broadhectare residential sites with very little residential population in 2006, the percentage increases were high at 4.5% to 11.1% per year—five to ten times the annual population growth rate of the state. Over 2006–11, these areas have witnessed the greatest and most intense environmental impacts from population growth—impacts that need to be addressed by environmentally sensitive urban design and biodiversity conservation principles.
Other SLAs in the Adelaide Statistical Division have experienced significant population growth over the last five years, particularly those in the councils of Port Adelaide Enfield (increase of 9960), Marion (4050) and Adelaide City (3320), where there has been substantial urban redevelopment and apartment construction in established residential areas. In these areas, the annual rate of increase was between 1.5% and 3.5%, significantly higher than the state rate. Population increases in the range of 1000–2000 over 2006–11 have been driven by residential redevelopment in the established inner city councils of Charles Sturt (increase of 4180), West Torrens (2800) and Campbelltown (1850), where increasing housing density has resulted in a more intensive use of existing urban infrastructure. However, the loss of backyards and tree cover has the potential to increase both the heat island effect and the level of stormwater run-off if care is not taken to offset these effects with more open space, tree plantings and water-sensitive urban design. The loss of backyards can also lead to a loss of suburban habitats for some species.
Other areas on the fringes of metropolitan Adelaide have absorbed some of the spillover growth from Adelaide—for example, Mount Barker Council and Gawler have had population gains of 2800 and 1500, respectively. Significant population gains of more than 1000 have also occurred in the regional LGAs of Alexandrina (increase of 2560), Murray Bridge (1800) Victor Harbor (1620), Copper Coast (1230) and Light (1120), with the rate of growth more than double the state’s average annual growth rate. Mount Gambier and Lower Eyre Peninsula also experienced significant growth in 2006–11. These regional LGAs gained population because of their desirable coastal locations and associated retirement migration, their status as regional population centres or their proximity to Adelaide.
|
Statistical division |
1976 |
1981 |
1986 |
1991 |
1996 |
2001 |
2006 |
2011a |
|||||||||||||||||||||||||||||||||||||||||||||||||||||||||||||||||||||||||||||||||||||||||||
|---|---|---|---|---|---|---|---|---|---|---|---|---|---|---|---|---|---|---|---|---|---|---|---|---|---|---|---|---|---|---|---|---|---|---|---|---|---|---|---|---|---|---|---|---|---|---|---|---|---|---|---|---|---|---|---|---|---|---|---|---|---|---|---|---|---|---|---|---|---|---|---|---|---|---|---|---|---|---|---|---|---|---|---|---|---|---|---|---|---|---|---|---|---|---|---|---|---|---|---|
Sources: ABS (2012e, and earlier years) | |||||||||||||||||||||||||||||||||||||||||||||||||||||||||||||||||||||||||||||||||||||||||||||||||||
|
Estimated resident population |
|||||||||||||||||||||||||||||||||||||||||||||||||||||||||||||||||||||||||||||||||||||||||||||||||||
|
Adelaide |
923 868 |
953 696 |
1 003 802 |
1 056 561 |
1 078 437 |
1 107 986 |
1 145 812 |
1 204 940 |
|||||||||||||||||||||||||||||||||||||||||||||||||||||||||||||||||||||||||||||||||||||||||||
|
Outer Adelaide |
60 648 |
69 839 |
81 894 |
93 231 |
104 331 |
113 992 |
128 770 |
138 682 |
|||||||||||||||||||||||||||||||||||||||||||||||||||||||||||||||||||||||||||||||||||||||||||
|
Yorke and Lower North |
40 646 |
41 721 |
43 592 |
43 996 |
44 150 |
44 398 |
45 494 |
46 522 |
|||||||||||||||||||||||||||||||||||||||||||||||||||||||||||||||||||||||||||||||||||||||||||
|
Murray Lands |
60 658 |
63 267 |
65 520 |
68 012 |
68 185 |
68 557 |
69 483 |
68 989 |
|||||||||||||||||||||||||||||||||||||||||||||||||||||||||||||||||||||||||||||||||||||||||||
|
South East |
59 525 |
61 628 |
62 893 |
62 855 |
62 707 |
62 588 |
64 492 |
64 105 |
|||||||||||||||||||||||||||||||||||||||||||||||||||||||||||||||||||||||||||||||||||||||||||
|
Eyre |
32 962 |
34 454 |
34 935 |
33 165 |
33 011 |
34 020 |
34 828 |
35 123 |
|||||||||||||||||||||||||||||||||||||||||||||||||||||||||||||||||||||||||||||||||||||||||||
|
Northern |
95 763 |
94 164 |
89 914 |
88 479 |
83 432 |
80 187 |
79 009 |
79 871 |
|||||||||||||||||||||||||||||||||||||||||||||||||||||||||||||||||||||||||||||||||||||||||||
|
Total |
1 274 070 |
1 318 769 |
1 382 550 |
1 446 299 |
1 474 253 |
1 511 728 |
1 567 888 |
1 638 232 |
|||||||||||||||||||||||||||||||||||||||||||||||||||||||||||||||||||||||||||||||||||||||||||
|
Population distribution (%) |
|||||||||||||||||||||||||||||||||||||||||||||||||||||||||||||||||||||||||||||||||||||||||||||||||||
|
Adelaide |
72.5 |
72.3 |
72.6 |
73.1 |
73.2 |
73.3 |
73.1 |
73.2 |
|||||||||||||||||||||||||||||||||||||||||||||||||||||||||||||||||||||||||||||||||||||||||||
|
Outer Adelaide |
4.8 |
5.3 |
5.9 |
6.4 |
7.1 |
7.5 |
8.2 |
8.5 |
|||||||||||||||||||||||||||||||||||||||||||||||||||||||||||||||||||||||||||||||||||||||||||
|
Yorke and Lower North |
3.2 |
3.2 |
3.2 |
3.0 |
3.0 |
2.9 |
2.9 |
2.9 |
|||||||||||||||||||||||||||||||||||||||||||||||||||||||||||||||||||||||||||||||||||||||||||
|
Murray Lands |
4.8 |
4.8 |
4.7 |
4.7 |
4.6 |
4.5 |
4.4 |
4.3 |
|||||||||||||||||||||||||||||||||||||||||||||||||||||||||||||||||||||||||||||||||||||||||||
|
South East |
4.7 |
4.7 |
4.5 |
4.3 |
4.3 |
4.1 |
4.1 |
4.1 |
|||||||||||||||||||||||||||||||||||||||||||||||||||||||||||||||||||||||||||||||||||||||||||
|
Eyre |
2.6 |
2.6 |
2.5 |
2.3 |
2.2 |
2.3 |
2.2 |
2.2 |
|||||||||||||||||||||||||||||||||||||||||||||||||||||||||||||||||||||||||||||||||||||||||||
|
Northern |
7.5 |
7.1 |
6.5 |
6.1 |
5.7 |
5.3 |
5.0 |
4.9 |
|||||||||||||||||||||||||||||||||||||||||||||||||||||||||||||||||||||||||||||||||||||||||||
|
Total |
100.0 |
100.0 |
100.0 |
100.0 |
100.0 |
100.0 |
100.0 |
100.0 |
|||||||||||||||||||||||||||||||||||||||||||||||||||||||||||||||||||||||||||||||||||||||||||
|
Growth |
1976–81 |
1981–86 |
1986–91 |
1991–96 |
1996–01 |
2001–06 |
2006–11 |
||||||||||||||||||||||||||||||||||||||||||||||||||||||||||||||||||||||||||||||||||||||||||||
|
Adelaide |
29 828 |
50 106 |
52 759 |
21 876 |
29 549 |
37 826 |
59 128 |
||||||||||||||||||||||||||||||||||||||||||||||||||||||||||||||||||||||||||||||||||||||||||||
|
Outer Adelaide |
9 191 |
12 055 |
11 337 |
11 100 |
9 661 |
14 778 |
9 912 |
||||||||||||||||||||||||||||||||||||||||||||||||||||||||||||||||||||||||||||||||||||||||||||
|
Yorke and Lower North |
1 075 |
1 871 |
404 |
154 |
248 |
1 096 |
1 028 |
||||||||||||||||||||||||||||||||||||||||||||||||||||||||||||||||||||||||||||||||||||||||||||
|
Murray Lands |
2 609 |
2 253 |
2 492 |
173 |
372 |
926 |
–494 |
||||||||||||||||||||||||||||||||||||||||||||||||||||||||||||||||||||||||||||||||||||||||||||
|
South East |
2 103 |
1 265 |
–38 |
–148 |
–119 |
1 904 |
–387 |
||||||||||||||||||||||||||||||||||||||||||||||||||||||||||||||||||||||||||||||||||||||||||||
|
Eyre |
1 492 |
481 |
–1 770 |
–154 |
1 009 |
808 |
295 |
||||||||||||||||||||||||||||||||||||||||||||||||||||||||||||||||||||||||||||||||||||||||||||
|
Northern |
–1 599 |
–4 250 |
–1 435 |
–5 047 |
–3 245 |
–1 178 |
862 |
||||||||||||||||||||||||||||||||||||||||||||||||||||||||||||||||||||||||||||||||||||||||||||
|
Total |
|
44 699 |
63 781 |
63 749 |
27 954 |
37 475 |
56 160 |
70 344 |
|||||||||||||||||||||||||||||||||||||||||||||||||||||||||||||||||||||||||||||||||||||||||||
|
Average annual growth rate (% per year) |
|||||||||||||||||||||||||||||||||||||||||||||||||||||||||||||||||||||||||||||||||||||||||||||||||||
|
Adelaide |
0.64 |
1.03 |
1.03 |
0.40 |
0.54 |
0.67 |
1.01 |
||||||||||||||||||||||||||||||||||||||||||||||||||||||||||||||||||||||||||||||||||||||||||||
|
Outer Adelaide |
2.86 |
3.24 |
2.62 |
2.30 |
1.79 |
2.47 |
1.49 |
||||||||||||||||||||||||||||||||||||||||||||||||||||||||||||||||||||||||||||||||||||||||||||
|
Yorke and Lower North |
0.52 |
0.88 |
0.18 |
0.10 |
0.11 |
0.49 |
0.45 |
||||||||||||||||||||||||||||||||||||||||||||||||||||||||||||||||||||||||||||||||||||||||||||
|
Murray Lands |
0.85 |
0.70 |
0.75 |
0.10 |
0.11 |
0.27 |
–0.14 |
||||||||||||||||||||||||||||||||||||||||||||||||||||||||||||||||||||||||||||||||||||||||||||
|
South East |
0.70 |
0.41 |
–0.01 |
0.00 |
–0.04 |
0.60 |
–0.12 |
||||||||||||||||||||||||||||||||||||||||||||||||||||||||||||||||||||||||||||||||||||||||||||
|
Eyre |
0.89 |
0.28 |
–1.03 |
–0.1 |
0.60 |
0.47 |
0.17 |
||||||||||||||||||||||||||||||||||||||||||||||||||||||||||||||||||||||||||||||||||||||||||||
|
Northern |
–0.34 |
–0.92 |
–0.32 |
–1.2 |
–0.79 |
–0.30 |
0.22 |
||||||||||||||||||||||||||||||||||||||||||||||||||||||||||||||||||||||||||||||||||||||||||||
|
Total |
|
0.69 |
0.95 |
0.91 |
0.40 |
0.50 |
0.73 |
0.88 |
|||||||||||||||||||||||||||||||||||||||||||||||||||||||||||||||||||||||||||||||||||||||||||
-01_fmt.jpeg)
Source: ABS (2012e)
Figure 5 Population trends for the statistical divisions of South Australia, 2006–11
Figure 7 highlights the regional SLAs where the average annual growth rates exceed 1.0%, including Unincorporated Far North, Ananga Pitjantjatjara, Roxby Downs, Unincorporated West Coast, Unincorporated Lincoln and Unincorporated Flinders Ranges. However, all these SLAs had small populations in 2006 and the increases represent less than 500 people over 2006–11. Some of these SLAs also have large proportions of Indigenous people and some of the population change is an artefact of a more complete enumeration of these populations in 2011 than in 2006.
Adjustments made by the ABS have resulted in a major downgrading of growth rates in the regional areas of the state (ABS 2012bc). This is evident in Figure 6, which shows the absolute change in population between the 2006 and 2011 censuses. Of the 127 SLAs mapped, 28 had population decreases of at least 100 people, mostly in the dryland agricultural areas of Eyre Peninsula, Yorke and Lower North, Murray Lands and South East Statistical Divisions.
The largest absolute population decreases were in the metropolitan area. The populations of Tea Tree Gully–North, Tea Tree Gully–Central, Onkaparinga–Morphett and Onkaparinga–Woodcroft decreased by approximately 200 to 1055 people as young adults moved away from home. Examination of the proportional losses in the metropolitan area (Figure 7) indicate that, because of the large base populations, these losses comprised less than 1.0% of the population. Figure 7 also indicates that losses in the range of 200–500 in areas such as Loxton Waikerie (East and West), Northern Areas District Council (DC), Peterborough DC, Renmark Paringa DC, Tatiara DC and the Coorong DC are a more significant percentage of these populations. This may have an adverse effect on the sustainability of the agricultural workforce and ultimately on the quality of environmental management in these more marginal areas, particularly as the rural workforce continues to age and is not fully replaced by young people. A further 33 SLAs on the northern margins of these SLAs had essentially stable populations between 2006 and 2011 (i.e. population gains or losses of 99 people or less).
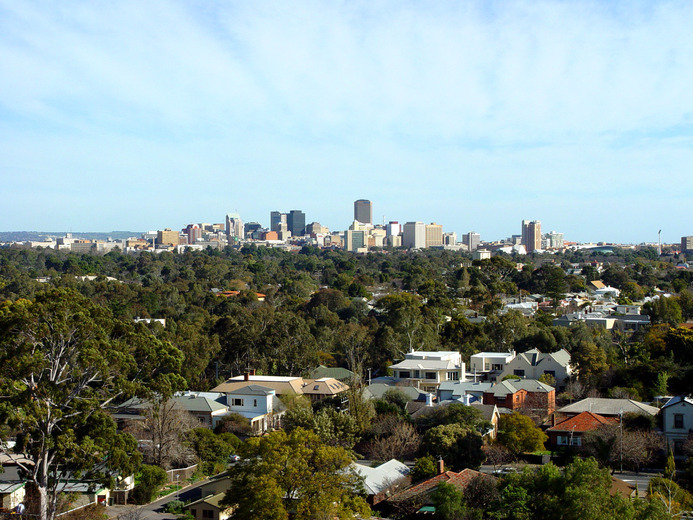
Adelaide central business district from the eastern suburbs
Department of Planning, Transport and Infrastructure
-01_fmt.jpeg)
Source: ABS (2012e)
Figure 6 Absolute change in estimated resident population by statistical local area, 2006–11
-01_fmt.jpeg)
Source: ABS (2012e)
Figure 7 Average annual percentage change in estimated resident population by statistical local area, 2006–11
2.3.2 Regional development
The South Australian Government has invested more than $30 million to support minerals exploration and mining in the state, and the number of mines has more than doubled in the past five years. In 2008, the mining sector contributed $2.8 billion to gross state product (4.3%) and employed about 7500 workers. In 2011, it contributed $3.9 billion to gross state product (5.1%) and employed about 8800 workers.
The growth in the mining sector, and its associated high wages, has led to a shift in rural employment, with significant numbers of farm owners and employees leaving the land for employment in the mining sector. This trend is likely to continue.
In addition to this, many people who are employed in the mining sector choose to fly in and fly out to work. Although most of these employees live in Greater Adelaide, a shift may occur with some employees seeking a lifestyle change (now affordable because of higher incomes) by relocating to regional centres.
The primary production sector has continued to perform strongly over the last five years. However, there is a continuing trend towards farm amalgamation and the loss of small family farms as a result of market volatility and prolonged drought, which damaged the dairy industry in the Lower Murray.
2.4 Heritage
South Australia’s heritage is made up of aspects of the past and the present that are considered worth protecting for the benefit of future generations. This heritage can include:
- wilderness, coastlines, native vegetation and threatened species
- historic buildings and monuments
- shipwrecks, lighthouses and whaling stations
- art, artefacts, fossils, and agricultural and industrial heritage
- customs, language and beliefs.
The significance and location of the heritage help to determine the type of protection needed—for example, World Heritage listings protect and conserve heritage of global importance, and there are also national, state and local listings. Local heritage places are listed in Local Council Development Plans through the Development Act 1993, and state heritage places are entered into the South Australian Heritage Register by a Register Committee appointed by the independent South Australian Heritage Council. Both processes require compliance with prescribed criteria for listing.
South Australia’s various heritage listings include:
- more than 6400 local heritage places and areas
- more than 2200 state heritage places and areas
- seven heritage places and areas in the Commonwealth Heritage List
- five heritage places and areas in the National Heritage List
- one heritage place (Naracoorte Fossil Mammal Site) in the World Heritage List.
The distribution of South Australian heritage sites in 2012 is shown in Figure 8.
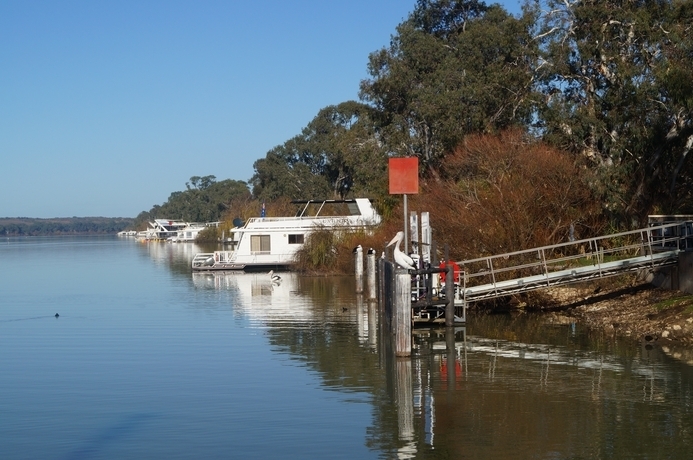
Houseboats at Mannum on the River Murray offer regional development through tourism
Belinda Scott
-01_fmt.jpeg)
Source: Data from the Australian Heritage Database, Australian Government Department of Sustainability, Environment, Water, Population and Communities
Figure 8 Heritage sites in South Australia, 2012