4 What are we doing about it?
The South Australian Government has established overarching policies and programs, as well as controls and activities to address specific pressures.
4.1 Policies and programs
South Australia has a number of policies and programs in place to address the pressures of population and economic growth in urban and regional areas.
4.1.1 Adelaide
Adelaide is characterised by low population densities, with mostly detached dwellings on medium-sized blocks of land (although the median lot size in South Australia is now one of the smallest in Australia), and residential areas sited some distance from places of employment. This dispersed, low-density type of urban design is very energy intensive and wasteful of land and other resources (Newman and Kenworthy 1989, Newman 1999, Trubka et al. 2007). The 30-Year Plan promotes a more sustainable, compact urban design while still enabling growth. This is to be achieved through a variety of means, including:
- increasing density
- co-locating services with transport and mixed-use development
- promoting walkable environments
- reducing overall reliance on car travel
- promoting short-distance travel and public transport
- increasing energy efficiency of buildings
- promoting alternative energy use
- promoting green technologies
- establishing networks of greenways and open space
- incorporating water-sensitive urban design techniques into new developments
- requiring new developments to be connected to alternative water sources.
The 30-Year Plan, as a whole-of-government policy, offers an opportunity to reduce the use of resources and create less waste and pollutants by decreasing car travel, promoting public transport and shortening the journey to work (Gray et al. 2010). It also offers improved access to services and employment.
The 30-Year Plan has set a target ratio of infill-to-fringe residential development of 70:30 by 2036. This will be achieved by locating the majority of new housing in existing zoned urban areas, particularly around transport corridors. With new building codes and planning policy, this should not increase exposure to noise and air pollution. In addition, to further protect rural lands from residential development, the government has introduced measures to protect the McLaren Vale and Barossa regions from residential subdivision.
In the first stage of the process, the government has developed a range of new land-use planning zones. These zones:
- allow a combination of major land-use types (such as residential, retail, office, commercial and civic) in compact and higher density growth and regeneration areas
- support an innovative mix of higher density urban development on land that abuts key transit corridors.
Higher density living within the Adelaide metropolitan area presents opportunities for more effective waste management and promotion of reuse, and redevelopment of existing infrastructure.
Initiatives to reduce the lot size of recently completed detached dwellings within Greater Adelaide and planning policy that promotes redevelopment in established urban areas have had a significant impact in slowing Adelaide’s urban sprawl. Since 2001, the number of small lot sizes (less than 600 square metres) had increased to such an extent that by 2006 they accounted for the majority of the detached dwelling completions in the Adelaide and Outer Adelaide Statistical Divisions (Figure 21). This trend has continued since 2006 and, by 2011, the median lot size in these two statistical divisions was just 416 square metres, significantly smaller than comparable estimates from other metropolitan areas interstate (HIA Economics Group 2011).
-01_fmt.jpeg)
Note: The data are for calendar years and exclude Kangaroo Island.
Source: June 2012 property cadastre and valuation snapshot, Department of Planning, Transport and Infrastructure
Figure 21 Lot size of detached dwellings by year of completion, Adelaide and Outer Adelaide statistical divisions, 1986–2011
In addition to, and complementing, the change to a compact urban design, the government is developing a range of water-sensitive urban design policies and initiatives, including a blueprint for urban water for Greater Adelaide that integrates use of all water sources, including stormwater and recycled wastewater. The blueprint will provide overall strategic direction for water planning in South Australia; refer to the Water chapter for more details.
4.1.2 South Australia’s Strategic Plan
Progress against South Australia’s Strategic Plan (SASP) (SASP Audit Committee 2012) includes:
- SASP Target 45: Increase South Australia’s population to 2 million by 2027.
This target is unlikely to be achieved because it requires an average annual growth rate of 1.26%, which is higher than the average annual growth rate recorded between 2003 and 2011 (0.9%). The target is also above the 1.1% ‘high growth’ scenario projection issued by the ABS (ABS 2008). Achievement of the target will be influenced by net overseas migration.
- SASP Target 46: Increase regional populations outside Greater Adelaide by 20 000 to a total of 320 000 or more by 2020.
Progress on this target is rated as ‘steady or no movement’ but ‘within reach’. A decrease in population between the 2010 baseline and 2011 and a change in boundaries mean that an increase of 25 400 people is required by 2020 to reach the target population of 320 000. At the current rate of net regional population growth, this target is likely to be met after 2020.
- SASP Target 56: Ensure the provision of key economic and social infrastructure accommodates population growth.
The target does not lend itself to ready assessment and the SASP Audit Committee recommended that the wording be reviewed. The formation of a new Department of Planning, Transport and Infrastructure in 2011 will help ensure that transport and infrastructure needs are considered in the early planning stages for areas of identified population growth.
- SASP Target 63: Increase the use of public transport to 10% of metropolitan weekday passenger vehicle-kilometres travelled by 2018.
Progress towards the target has been assessed as positive and its achievement as within reach, although public transport use is required to increase at an accelerated rate to achieve the target by 2017–18. Significant activity is focused on improving public transport, supported by implementation of the
30-Year Plan. - SASP Target 67: Reduce waste to landfill by 35% by 2020.
This is an ambitious goal, but achievement of the target is within reach. The government released an updated waste strategy (Zero Waste SA 2011) in December 2011 with two key objectives: maximising the useful life of materials through reuse and recycling, and avoiding and reducing waste.
- SASP Target 68: By 2036, 70% of all new housing in metropolitan Adelaide will be being built in established areas.
This is a new target in the 2011 SASP and was tracking at 57% in 2010. This reflects current levels of land supply in the various locations at the beginning of the intended life of the 30-Year Plan. In addition, in 2010, 43.5% of the newly built houses in metropolitan Adelaide were built within 800 metres of the current or extended transit corridors indicated in the 30-Year Plan. Opportunities for more infill around transit corridors will increase as local development plans are amended to introduce new zoning policies.
In SASP 2012, the South Australian Government announced seven strategic priorities that identified the areas of the SASP that the government has chosen to focus on (DPC 2012). The work, budgets, policymaking and legislative agenda of the government will reflect these priorities. The seven priorities are:
- creating a vibrant city
- safe communities, healthy neighbourhoods
- an affordable place to live
- every chance for every child
- growing advanced manufacturing
- realising the benefits of the mining boom for all
- premium food and wine from our clean environment.
4.1.3 Planning Strategy for South Australia
Progress against the Planning Strategy for South Australia (PSSA; Government of South Australia 2011a) (to December 2011) includes:
- The share of overall new housing in the established areas of metropolitan Adelaide as a proportion of the total housing built across the remainder of Greater Adelaide, including fringe areas and towns and rural locations, has tracked between 56% and 58% in 2008–10.
- Ecosystem restoration initiatives, including tree planting and revegetation, are being undertaken by the natural resource management (NRM) boards (see the Introduction for more information on NRM regions) and local councils. Work undertaken by the Adelaide and Mount Lofty Ranges NRM boards during 2009–10 to increase the extent of functional ecosystems included reconstruction of 243 hectares of land, and management of native vegetation on 7339 hectares of land.
- Climate change modelling indicates that new urban design will contribute to an overall decline in the state’s greenhouse gas emissions.
- Air quality is being addressed as part of the government’s planning policy reforms, the first stage of which was completed in 2011.
- The government has committed $12 million over four years towards the development of greenways (including cycling and walking corridors) along major transit corridors. Work commenced in 2010–11 on developing a greenway from Adelaide to Marino Rocks along the Noarlunga rail line.
- Water-sensitive urban design and natural resource management will be addressed as part of PSSA reforms, likely to be undertaken from 2013–15.
- In 2010–11, renewable energy comprised 22% of South Australia’s electricity production. This is considerably higher than the 4.1% recorded in 2004–05 and the 9.7% in 2007–08, and is already above the Strategic Plan target of 20% renewable energy production by 2014 (DPC 2012).
- New dwellings, or additions of more than 50 square metres that include a wet area, are required to be connected to rainwater tanks and have hot water systems that are either solar heated, gas heater compliant or wood combustion heated.
4.2 Transport
Complementing the new urban design, which supports compact development and less reliance on individual car travel, the South Australian Government is attempting to decrease the impact of transport on the environment by promoting active travel (e.g. cycling and walking) and expanding and modernising the state’s public transport.
The government has developed a ‘Streets for People’ (South Australian Active Living Coalition 2012ab) compendium to provide guidance for a rethink of conventional street design to support increased physical activity. The compendium presents key principles to shape pedestrian and cycling-friendly streets, introduces the Link and Place street design approach, and clarifies the approval process and addresses risk and liability issues. The Streets for People principles have already influenced emerging designs in the Bowden Development and the Leigh and Bank streets revitalisations.
Significant public transport works are currently under way to improve the public transport network. A reliable and effective public transport system is a key tool to successfully implementing new urban design. In 2008 the South Australian Government began a decade-long investment ($2.6 billion including Australian Government funding) to provide faster, more frequent, less energy intensive, less polluting and more efficient services for train, tram and bus customers, and a safer public transport system. Changes include the following:
- An extra 100 buses are now on the network, providing more than 750 additional services focusing on high-demand areas and incorporating an extension of Adelaide Metro bus services to Gawler. Adelaide’s most used public transport corridor, the O-Bahn bus way, is now serviced by more buses.
- An extended tram line to the Adelaide Entertainment Centre provides a free public transport option to customers, along with a park-and-ride facility.
- The tram line has been extended, providing a service from Glenelg to the city and Hindmarsh. An additional four trams were introduced in 2011–12, bringing the total fleet number to 21.
- The South Australian Government has committed to a long-term investment in public transport, including a 5.5-kilometre extension of the Noarlunga rail line to Seaford. Future plans include completing the electrification of the Seaford line and adding up to 66 new electric railcars. Complete electrification of the Gawler and Outer Harbour lines remains a target.
- The train line upgrades are the first steps towards electrification of the metropolitan network, which will result in significant reductions of carbon dioxide emissions for the state.
- Almost 300 extra buses over the next decade will deliver bus feeder services, linking local areas to dedicated rail corridors and high-frequency bus corridors.
The average age of South Australia’s vehicle fleet decreased from 11.1 years to 10.1 years between 2006 and 2012. Vehicles manufactured in 2010 are the most prevalent in the state’s fleet, with 70 895 of these vehicles registered on our roads. Newer, more fuel-efficient vehicles will increase the fuel efficiency of the vehicle fleet and result in reduced emissions.
Of the 730 885 cars registered in South Australia in May 2012, 1858 (0.25%) were hybrid electric vehicles (ABS 2012f). Although this represents a small fraction of the total, hybrid technology vehicles have been available in fewer models and with relatively higher prices compared with traditional internal combustion engine vehicles. Uptake has been at the slower rates normally experienced by new technologies, with early adopters and government fleets assisting uptake in South Australia. Given the average age of the state’s vehicle fleet, it will take several more years for this category of more fuel-efficient vehicles to substantially affect the private vehicle emissions of our communities. To this end, the government has committed to developing a low-emission vehicle strategy for South Australia, which will aim to reduce greenhouse gas and toxic air emissions from road-based freight and passenger vehicles by increasing the proportion of low-emission vehicles on our roads.
As of 2011, more than 22% of Adelaide’s metropolitan bus fleet runs on compressed natural gas, which produces lower carbon dioxide emissions compared with traditional diesel. Research has also shown that heavy vehicles using compressed natural gas generally produce significantly less particulate matter (PM10), sulfur and nonmethane volatile hydrocarbons (air toxics) (Beer et al. 2001). Compared with their diesel counterparts, the Adelaide Metro’s gas buses produce up to 50% less carbon dioxide, up to 80% less carbon monoxide and up to 90% less nitrogen oxide emissions, as well as reducing traffic noise.
The metropolitan bicycle network (Bikedirect) has expanded rapidly over the past five years. The total length of shared-use paths and roadways with bike lanes or sealed shoulders increased by 76% between 2006 and 2011.
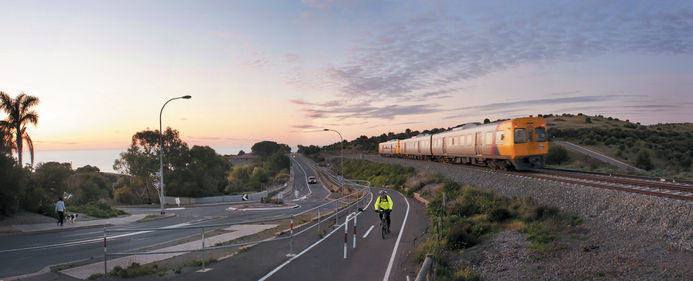
Optional modes of travel in southern Adelaide
Department of Planning, Transport and Infrastucture
4.3 Pollution
Pollution control and monitoring is an important role of the South Australian EPA.
4.3.1 Pollution-related enforcement and compliance
The EPA administers approximately 2100 licences for activities of environmental significance and undertakes a risk-based approach to ensuring compliance with requirements. The number of inspections of high-priority sites during 2009–12 were as follows:
- 2009–10: 961
- 2010–11: 257
- 2011–12: 283.
The inspections resulted in a range of actions, including verbal and formal written warnings and environment protection orders (EPOs). For a small number of more serious cases of noncompliance, the EPA commenced civil or criminal prosecutions.
4.3.2 Environment protection orders
EPOs can be issued for the purpose of securing compliance with:
- the general environmental duty
- a condition of an environmental authorisation
- a condition of a beverage container approval
- any other requirement imposed by or under the Environment Protection Act 1993
- an environment protection policy.
The number of EPOs issued by the EPA has remained steady, and the number issued by police and local councils has declined (Table 5). The reason for this significant downward trend for police and local councils is not known; it could be the result of an increase in verbal orders in place of written orders, a decrease in reporting of orders issued, a drop in contraventions, or a reduction in resources allocated to pollution matters by these authorities.
|
Organisation |
2007–08 |
2008–09 |
2009–10 |
2010–11 |
2011–12 |
||||||||||||||||||||||||||||||||||||||||||||||||||||||||||||||||||||||||||||||||||||||||||||||
|---|---|---|---|---|---|---|---|---|---|---|---|---|---|---|---|---|---|---|---|---|---|---|---|---|---|---|---|---|---|---|---|---|---|---|---|---|---|---|---|---|---|---|---|---|---|---|---|---|---|---|---|---|---|---|---|---|---|---|---|---|---|---|---|---|---|---|---|---|---|---|---|---|---|---|---|---|---|---|---|---|---|---|---|---|---|---|---|---|---|---|---|---|---|---|---|---|---|---|---|
|
EPA = Environment Protection Authority | |||||||||||||||||||||||||||||||||||||||||||||||||||||||||||||||||||||||||||||||||||||||||||||||||||
|
EPA |
15 |
22 |
25 |
15 |
21 |
||||||||||||||||||||||||||||||||||||||||||||||||||||||||||||||||||||||||||||||||||||||||||||||
|
Police |
139 |
144 |
128 |
53 |
20 |
||||||||||||||||||||||||||||||||||||||||||||||||||||||||||||||||||||||||||||||||||||||||||||||
|
Councils |
53 |
7 |
23 |
8 |
0 |
||||||||||||||||||||||||||||||||||||||||||||||||||||||||||||||||||||||||||||||||||||||||||||||
|
Total |
207 |
173 |
176 |
76 |
41 |
||||||||||||||||||||||||||||||||||||||||||||||||||||||||||||||||||||||||||||||||||||||||||||||
4.3.3 Investigations and prosecutions
More serious incidents of pollution may result in civil or criminal prosecutions. The EPA has a dedicated investigations branch that examines breaches of the Environment Protection Act 1993, and the number of investigations has remained relatively steady over the past four years (Table 6).
|
Year |
Investigations undertaken |
Investigations finalised |
|---|---|---|
|
2008–09 |
30 |
14 |
|
2009–10 |
44 |
25 |
|
2010–11 |
36 |
17 |
|
2011–12 |
35 |
20 |
4.3.4 Air
Air quality is affected by actions controlled at all levels of government. For example, standards for emissions from vehicles and small engines are a national responsibility, control of dust from a residential development is the responsibility of local councils, emissions from large industries are regulated by the EPA, planning authorities must consider air quality in assessing new developments, and emergency services authorities are involved in protecting public health from smoke and toxic fumes.
The key measures and actions for managing air quality in South Australia are described in this section.
National standards
Australia has national standards for six pollutants contained in the Air NEPM:
- carbon monoxide
- nitrogen dioxide
- ozone
- sulfur dioxide
- lead
- particles (PM10 and PM2.5).
The Air NEPM came into effect in 1998 and has recently undergone a comprehensive 10-year review. The review confirmed the higher risk of particles relative to the other pollutants and, in response, a project to develop a National Plan for Clean Air is now under way, under the auspices of the Standing Council on Environment and Water, which consists of environment ministers from the Australian Government and all state and territory governments (COAG 2012).
An important source of air pollutants is vehicle fuels, which are regulated under the Fuel Quality Act 2001 (Cwlth). South Australia is an active participant in the development of fuel standards that include consideration of air quality, such as through limiting components and additives that contribute to toxic emissions to the atmosphere. The South Australian Government also released a low-emission vehicle strategy in 2012 that promotes the use of alternative fuels and the development of vehicle technologies that have smaller impacts on air quality, including through support of the Automotive Collaborative Research Centre.
Other areas where South Australia is actively participating in the development of national standards to improve air quality are the establishment of product standards for the import, manufacture and sale of wood heaters, small engines used in garden equipment, generators and marine engines.
National Plan for Clean Air
The National Plan for Clean Air has its main focus on reducing the exposure of the Australian population to fine particles, but it will also examine the risks of nitrogen dioxide, ozone and sulfur dioxide. The carbon monoxide standard is not being reviewed at this stage, because carbon monoxide generally occurs at very low levels in ambient air that are well below the standard and are not considered to be a significant risk to people living in Australian cities.
There are no identified threshold concentrations for particles below which there are no effects on humans. This means that, even when concentrations are below the current standards, there is still some risk to our communities. Although the effects on individuals may appear relatively small, the costs of air pollution impacts may add up to substantial amounts in a population of a million or more. That means that it is important that air quality is as good as can be achieved in balance with other lifestyle, social and economic needs of our communities. There are benefits to any improvement in air quality, even if the national standards are not always achieved.
Recognising this value of improving air quality, the National Plan for Clean Air project is considering a long-term exposure reduction goal, which will complement current standards and provide a basis for measuring the performance of each state and territory government in improving the risks to its communities from air pollution. Its final form and how it will be measured will become clearer as the plan takes shape in 2013–14.
The plan is projected for completion in late 2014 and will, for the first time, provide a national framework to help jurisdictions implement abatement programs, including performance measures towards achieving the Air NEPM particle standards over the next 10 years and beyond. The South Australian Government is actively involved in the development of the National Plan for Clean Air, through the EPA and the Department for Health and Ageing.
Environment protection
The Environment Protection Act 1993 is the legislative foundation for regulating air quality in South Australia. The Act creates a general duty to take all reasonable and practical steps to prevent environmental harm. It enables the development of specific environment protection policies such as the Environment Protection (Air Quality) Policy; provides the basis for imposing conditions on business and industries to improve their performance in minimising risk from emissions to air through a licensing system; and allows for input to conditions on new developments to minimise their impacts on air quality, such as through guidelines on separation distances.
Specific actions to improve air quality under the Act include:
- improving information for communities about air quality through the EPA website and targeted campaigns (e.g. more effective operation of wood heaters)
- establishing emission limits and ground-level concentrations (EPA 2006)
- establishing guidelines on methods and standards for monitoring emissions, including for stack testing, quality requirements and reporting
- developing environment improvement programs as part of licensing conditions for industries with significant emissions
- requiring the use of best available technology and practice in managing emissions
- monitoring and modelling air quality through a network of monitoring stations
- establishing licence conditions that focus on risk management
- establishing tight controls on the management of dust from transportation or materials handling activities
- developing an air quality health warning system
- developing an emergency response to emission incidents to support emergency services.
Development
The Development Act 1993 requires the development of a planning strategy for the state, which sets planning and development policy. As part of the planning strategy, the South Australian Government published the 30-Year Plan in 2010 (DPLG 2010a), which provides the overarching strategic direction for planning Adelaide, and incorporates a range of targets and policies for improving air quality for people living or working in the city.
In support of this objective, in September 2011 the government released Healthy connected communities: creating healthy urban villages for the future—transit-oriented developments through a health lens (Government of South Australia 2011b) that provides guidance on incorporating healthy design into developments, including designing for good air quality.
In 2012, the government also released Reducing noise and air impacts from road, rail and mixed land use: a guide for builders, designers and the community (DPTI 2012), which provides guidance on the principles and possible approaches for designing residential, mixed-use or other sensitive developments to minimise adverse impacts to communities from major transport corridors.
The South Australian planning policy promotes more consistent and better development policies across local councils, including the creation of overlays for transport corridors in development plans. The policy requires development authorities to consider air quality issues from major road and rail traffic when assessing development proposals.
The flow of traffic has a major impact on air quality (the slower the traffic, the higher the pollution) and a number of initiatives have recently been undertaken or are in progress to improve traffic flow in Greater Adelaide. This includes major road upgrades such as the North–South Corridor, improvements to roads in the eastern suburbs, introduction of bus-only lanes in Adelaide City, rail extension projects (Gawler and Seaford), overpasses (Keswick and Oaklands) and promotion of alternative transport (bicycle lanes, Greenways project, cycling information program).
Public health
The South Australian Public Health Act 2011 provides for the protection of South Australians’ health and the reduction of the incidence of preventable illnesses such as those caused by air pollution. The Act requires that a state public health plan is developed that assesses the state of public health in South Australia, identifies existing and potential public health risks, and develops strategies for addressing (eliminating or reducing) those risks. It also needs to identify opportunities and outline strategies for promoting public health in the state.
A draft of the first state public health plan was released for public consultation at the time of writing and clearly includes clean air as a requirement for and determinant of good health, noting that exposure to urban air pollution accounts for 2.3% of all deaths. The plan anticipates an increase in respiratory diseases and allergies from the likely increase in air pollution (from dust and bushfires) under a changing climate. It identifies the health benefits of a focus on green infrastructure—an interconnected network of physical assets that deliver landscape and environmental values or functions—for improving air quality.
Local government
One of the functions of South Australian local councils is to manage, develop, protect, restore, enhance and conserve the local environment, and improve amenity. Councils are therefore often at the forefront of air quality issues.
Greater Adelaide is a large and diverse city, comprising older, established areas and young suburbs that are actively growing around new commercial hubs; more industrialised areas with particular problems at interfaces between competing land uses; and areas in the Adelaide Hills with a unique mix of activities. While some air quality issues are common to all urban areas, many councils may face individual issues. Many councils have been highly active in developing their own environmental strategies, addressing issues ranging from adaptation to climate change to improving lifestyle choices for residents regarding local transport, many of which have the potential for direct benefits for air quality.
Reflecting this multipronged approach to managing air quality, the EPA has developed an Air Quality Framework for prioritising and coordinating actions in response to pressures on air quality. The framework aims to:
- promote increased engagement with communities with readily accessible and good-quality information on air quality
- improve mechanisms for coordinating air quality management actions
- integrate air quality considerations early in planning and design (including through guidelines, standards and model policies)
- review the Environment Protection (Air Quality) Policy
- provide better guidance for industry on monitoring, modelling and reporting
- improve knowledge through targeted research and investigations.
In accordance with the new population exposure approach, the EPA is building two new monitoring stations in support of the 30-Year Plan. One will be in the Adelaide CBD and another on the Le Fevre Peninsula. The locations of existing monitoring stations are shown in Figure 22.
Air pollution from transport
The EPA is working on a number of research projects to better understand air pollution from transport and its impact on the Adelaide airshed, including the development of a model for reducing the population’s exposure to emissions. The EPA is also involved in quantifying the impact on air quality of the government’s future programs and targets, such as the railway electrification and the reduction in vehicle-kilometres travelled by motorists under the 30-Year Plan.
During 2012, the EPA extended its collaboration with the University of South Australia to support a PhD project aimed at improving calculations of motor vehicle emissions in the inventory database and producing the framework for reducing the population’s exposure to traffic emissions. The EPA also partnered with the University of Adelaide and the Department for Health and Ageing in a project investigating the benefits of alternative transport on air quality and public health.
Air pollution from significant industries
Nyrstar operates one of the world’s largest lead-smelting facilities in Port Pirie. Historically, the smelter has been the source of the well-documented lead contamination in the township and high levels of blood lead in the local community.
The tenby10 program, a five-year partnership between Nyrstar, the state government and the local council, concluded at the end of 2010. The Port Pirie monitoring site has recorded declining levels of lead (Figure 23). This program made significant progress in reducing the number of children with blood lead levels above 10 micrograms per decilitre from 60% to 25%; however, the blood lead levels of some children were still above the National Health and Medical Research Council recommended levels.
The EPA has continued to oversee Nyrstar’s compliance with current lead emission reduction programs, to ensure that all available measures are in place to reduce emissions as far as practicable with the existing plant technology. During 2011–12, the EPA reviewed and strengthened Nystar’s EPA licence by including additional challenging requirements for the company, with the aim of substantially reducing emissions from the smelter and the blood lead levels in the community. This was followed by an announcement that the South Australian Government and the Australian Government would support upgrades to the ageing smelter.
The EPA also conducts monitoring for sulfur dioxide at Port Pirie according to the requirements of the Air NEPM. Table 7 shows the trends in sulfur dioxide exceedences of the 1-hour and 24-hour NEPM standards. The goal for the 1-hour and 24-hour standards is that they should not be exceeded more than once per year.
The annual average sulfur dioxide concentration at the monitoring station in Port Pirie does not exceed the Air NEPM standard of 0.02 parts per million (Figure 24).
Other significant industries with impacts on air quality include:
- OneSteel iron ore plant at Whyalla
- Shell Bitumen fuel storage and bitumen processing and blending at Birkenhead
- Penrice Quarry at Angaston
- Adelaide Brighton Cement at Port Adelaide.
|
|
|
|---|---|
|
|
|
|
|
-05_fmt.jpeg)
-03_fmt.jpeg)
-01_fmt.jpeg)
-02_fmt.jpeg)
-04_fmt.jpeg)
Figure 22 South Australian air monitoring stations
-01_fmt.jpeg)
μg/m3 = micrograms per cubic metre; NEPM = National Environment Protection (Ambient Air Quality) Measure
Note: Daily sampling commenced at the Ellen Street and Port Pirie West Primary School sites on 28 October 2010.
Source: Environment Protection Authority data
Figure 23 Annual lead concentrations at Port Pirie monitoring sites, 2003–12
-01_fmt.jpeg)
Source: Environment Protection Authority data
Figure 24 Sulfur dioxide concentration against the National Environment Protection (Ambient Air Quality) Measure standard at the Environment Protection Authority Oliver Street site in Port Pirie, 2003–12
|
Year |
Number of exceedences of the 1-hour standard for sulfur dioxide (0.2 ppm) |
Number of exceedences of the 24-hour standard for sulfur dioxide (0.08 ppm) |
|||||||||||||||||||||||||||||||||||||||||||||||||||||||||||||||||||||||||||||||||||||||||||||||||
|---|---|---|---|---|---|---|---|---|---|---|---|---|---|---|---|---|---|---|---|---|---|---|---|---|---|---|---|---|---|---|---|---|---|---|---|---|---|---|---|---|---|---|---|---|---|---|---|---|---|---|---|---|---|---|---|---|---|---|---|---|---|---|---|---|---|---|---|---|---|---|---|---|---|---|---|---|---|---|---|---|---|---|---|---|---|---|---|---|---|---|---|---|---|---|---|---|---|---|---|
|
ppm = parts per million | |||||||||||||||||||||||||||||||||||||||||||||||||||||||||||||||||||||||||||||||||||||||||||||||||||
|
2003 |
21 |
1 |
|||||||||||||||||||||||||||||||||||||||||||||||||||||||||||||||||||||||||||||||||||||||||||||||||
|
2004 |
31 |
0 |
|||||||||||||||||||||||||||||||||||||||||||||||||||||||||||||||||||||||||||||||||||||||||||||||||
|
2005 |
29 |
0 |
|||||||||||||||||||||||||||||||||||||||||||||||||||||||||||||||||||||||||||||||||||||||||||||||||
|
2006 |
33 |
0 |
|||||||||||||||||||||||||||||||||||||||||||||||||||||||||||||||||||||||||||||||||||||||||||||||||
|
2007 |
35 |
0 |
|||||||||||||||||||||||||||||||||||||||||||||||||||||||||||||||||||||||||||||||||||||||||||||||||
|
2008 |
28 |
0 |
|||||||||||||||||||||||||||||||||||||||||||||||||||||||||||||||||||||||||||||||||||||||||||||||||
|
2009 |
29 |
2 |
|||||||||||||||||||||||||||||||||||||||||||||||||||||||||||||||||||||||||||||||||||||||||||||||||
|
2010 |
35 |
0 |
|||||||||||||||||||||||||||||||||||||||||||||||||||||||||||||||||||||||||||||||||||||||||||||||||
|
2011 |
40 |
0 |
|||||||||||||||||||||||||||||||||||||||||||||||||||||||||||||||||||||||||||||||||||||||||||||||||
|
2012 |
33 |
0 |
|||||||||||||||||||||||||||||||||||||||||||||||||||||||||||||||||||||||||||||||||||||||||||||||||
4.3.5 Noise
South Australian Government agencies consider noise impacts when developing planning policy and assessing development applications from all significant industrial, transport and infrastructure projects. Construction occurs in accordance with noise and vibration management plans.
A draft Minister’s Specification was developed in 2011 for construction requirements for the control of external sound, which mandates building standards for residential developments near major road and rail transport corridors. The intent of this specification is to protect the occupants of residential buildings from existing or future road and rail sound, and from mixed land-use sound sources. The specifications set minimum standards that the external walls, windows, external doors, roof, ceilings, ground floor and ventilation of a building must meet to prevent loss of amenity to the occupants against external sound intrusion from road and rail movements, and from people in public places and entertainment venues where music is played. The specifications set internal sound criteria (in decibels) for bedrooms and other habitable rooms that must not be exceeded.
The EPA has commenced a strategic noise monitoring program in the Greater Adelaide region, particularly in areas adjacent to major transport corridors such as the Bowden Urban Village.
The EPA takes into account the need for specific conditions relating to noise when licensing activities under the Environment Protection Act 1993. The licensees are subject to strict environmental and noise impact rules, and the operations must meet requirements in the Environment Protection (Noise) Policy 2000. In addition to the policy, the EPA has developed guidelines, information sheets and other relevant documents to assist developers, planning authorities and other agencies to predict and assess environmental noise.
Despite the current lack of firm evidence that wind farms are sources of excessive infrasound, or that wind farm noise is deleterious to the health of nearby residents, in 2009 the EPA developed noise guidelines for wind farms to protect the community from excessive noise exposure.
Australian states and territories are working together to develop noise-labelling requirements for a range of household devices. The EPA is conducting research into improving methods and procedures for measuring and assessing noise to inform compliance and noise mitigation measures.
4.3.6 Site contamination
The EPA is continually improving available information of historical site contamination, and provides advice to ensure that site contamination is identified, assessed and managed for all new developments in South Australia.
The Adelaide-based Cooperative Research Centre for Contamination Assessment and Remediation of the Environment (CRC CARE) is developing new ways of dealing with and preventing contamination of soil, water and air. The EPA is a shareholder of CRC CARE and participates in its research programs.
4.3.7 Radiation
South Australian radiation protection legislation (Radiation Protection and Control Act 1982) requires X-ray machines and radioactive sources to be registered. The number of radioactive sources to be registered has not significantly increased over the last decade; however, the number of X-ray apparatus has. Although applications for individual years vary according to factors such as the economy, machine replacement cycles and uptake of new technologies, there has been a significant upward trend in applications to register these apparatus (Figure 25), with an increase in the complexity and use of dental and medical imaging apparatus. Changes to the Medicare system flagged by the Australian Government (e.g. setting a lifespan of 10 years for apparatus) is likely to increase further applications for new apparatus in coming years.
-01_fmt.jpeg)
Source: Environment Protection Authority data
Figure 25 Applications for registration of dental, medical and veterinary X-ray apparatus, 2000–01 to 2011–12
There were approximately 7500 radiation workers in South Australia in 2012, with approximately 75% required to hold an appropriate radiation licence to use or handle radioactive substances, or operate radiation apparatus. There is a shortage of radiation protection professionals across a wide range of industries, including in the medical, mining and scientific sectors. For example, South Australia has approximately half the required number of diagnostic imaging medical physicists (based on internationally accepted staffing level criteria).
Amendments to the Radiation Protection and Control Act 1982 were proposed in 2013 that will incorporate modern administrative and enforcement provisions, as well as nationally agreed provisions aimed at ensuring the security of radioactive sources. In response to reported research on the adverse health impacts on users of tanning salons, legislation is also planned to ban the commercial use of cosmetic tanning units from 31 December 2014.
Employers of radiation workers, owners of X-ray apparatus or sealed radioactive sources, and occupiers of premises where unsealed radioactive substances are used or handled are required by law to report any radiation accidents to the EPA. Radiation accidents include situations where the control of a radiation source has been lost, or a person has or may have been accidentally exposed to ionising radiation. The EPA investigates radiation accidents and incidents to determine the cause and any remedial action that could be taken to prevent recurrence. More details about the nature of these incidents are available from EPA annual reports, and details of environmental spill events at uranium mines are available on the Department for Manufacturing, Innovation, Trade, Resources and Energy website (www.pir.sa.gov.au/minerals/licensing_and_regulation/mining_operations/uranium_mine_incident_reporting).
The South Australian Health and Medical Research Institute intend to install a cyclotron to produce nuclear medicine isotopes. It is anticipated that the cyclotron will be ready for commissioning in 2013.
4.4 Waste
South Australia signed the 2009 National Waste Policy: less waste, more resources (DEWHA 2009). The policy sets a 10-year framework of priorities and principles aimed at tackling problems such as electronic waste (e-waste), hazardous materials and product stewardship. A first priority under the policy was a national scheme for televisions and computers. The Product Stewardship Regulations (Televisions and Computers) 2011 came into effect on 3 November 2011 and provide for national, industry-run arrangements for collecting and recycling end-of-life televisions, computers and computer products under the National Television and Computer Recycling Scheme. This has led to the emergence of new industries that recycle these products and their components, and a decrease in the amount of e-waste going to landfill. Currently in South Australia, more than 50 local companies are reprocessing paper, metal, glass, plastics, tyres, concrete, asphalt, timber, e-waste and garden organics.
For example, to assist in the reuse of contaminated soils, the EPA has developed a standard (released in January 2010) for the production and use of waste-derived fill. This details the information and processes required to support the beneficial reuse of a range of wastes that are specifically recovered for use as fill, including contaminated soils.
South Australia’s Environment Protection (Waste to Resources) Policy 2010 (EPA 2010) came into operation on 1 September 2010. It progressively banned certain wastes from going to landfill and required waste (subject to specified exemptions) to be subject to approved resource recovery.
Implementation of South Australia’s Waste Strategy (2005–10) included a range of programs such as:
- support for local councils to improve kerbside recycling by providing approximately 685 000 households with access to two or three-bin systems
- financial incentives to regional areas for upgrading or building new infrastructure that improves recovery and recycling of materials in all South Australian regional areas. As at November 2012, $6.4 million has been awarded to 102 projects under Zero Waste SA’s Regional Implementation Program since 2005. Projects have been awarded in all regional local government areas—Central, Eyre Peninsula, South East, Murray Mallee, and Southern and Hills—to support infrastructure projects that improve the effectiveness of sorting processes. As at November 2012, $4.5 million has been awarded for 20 metropolitan infrastructure projects, leveraging about $10 million in industry investment under Zero Waste SA’s Metropolitan Infrastructure Program since 2005. This has contributed to new ventures in the areas of e-waste, composting, recycling of construction and demolition waste, and improved regional waste planning and infrastructure.
The Southern Hemisphere’s first television and computer glass screen processing plant was funded under this program at Gepps Cross - grants to schools and community groups to promote recycling
- incentives to improve and expand recycling in the business sector. For example, Zero Waste SA’s Industry Program helps a diverse range of businesses and government agencies to improve resource efficiency practices. Since the inception of the program in 2007, 191 organisations across 436 sites have been directly engaged to participate in projects funded under the program. A further 249 organisations have attended one or more of the 28 training programs offered
- a plastic bag ban
- household e-waste collections. For example, Zero Waste SA has provided funding to councils for a range of programs to help recover unwanted e-waste. These have included establishing 29 drop-off points in regional areas affected by the switchover from analogue to digital signalling from December 2010 to February 2011, and coordinating two-day e-waste collection events that were funded by a major brand owner in September 2010 and December 2011. A government free e-waste drop-off program held during May 2012 in partnership with 13 inner regional councils collected 1039 tonnes of e-waste, which included 16 583 televisions and 6196 computers. Nationally, the Australian Government and the television and computer industry are rolling out the National Television and Computer Recycling Scheme for the collection and recycling of end-of-life televisions and computers. As at December 2012, South Australia had 13 services under this scheme.
Other initiatives of the South Australian Government include:
- allocating more than $930 000 to 17 organisations to assist projects that focus on sustainable markets for industry sectors, and to increase and support markets for recycled materials. These grants have targeted waste streams such as aggregate and soil products, composts, mulches and recycled organic products, plastics, alternatives to chromated copper
arsenate–treated timber products, glass, reused or second-hand products, and products that use industrial residues and slags, and their associated recycling industries - supporting recycling collection for small to medium businesses under Zero Waste SA’s Recycling at Work program by working with waste collection companies to introduce source-separated commingled dry recycling and/or organics collection. From October 2008 to April 2012, 3274 new customers took up 3570 new recycling services. This yielded 19 612 tonnes of recycled materials
- establishing an illegal dumping unit to investigate and enforce illegal dumping of demolition and industrial waste, illegal waste operations, illegal recyclers and illegal waste transfer stations
- using the waste levy as a market-based incentive for reducing disposal of some materials to landfill, increase recycling, and to invest in waste management programs and projects.
A remaining area for improvement is to harmonise the regulatory requirements for waste and recycling between states and territories through common frameworks for waste assessment, data collection and measurement. This could further improve the efficiency of recycling.
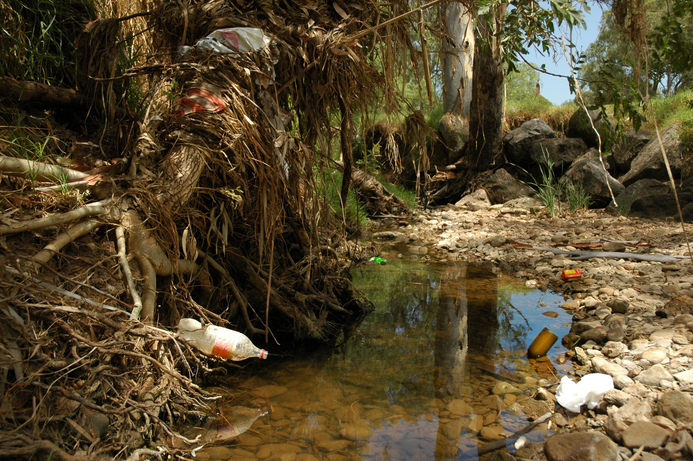
Litter in creek
Zero Waste SA
4.5 Heritage
Specific legislation provides for the registration, conservation and development of places and areas of heritage significance. In support of the legislation, the South Australian Government released Heritage directions 2012: a future for heritage in South Australia (Government of South Australia 2012) as an update to the government’s heritage policy framework released in 2003.
Since 2008, two South Australian places have been added to the National Heritage List, bringing the total number to five:
- Adelaide Park Lands and City Layout (new)
- Wiltjira–Dalhousie Springs (new)
- Australian Fossil Mammal Sites (Naracoorte)
- Ediacara Fossil Site, Nilpena
- Old and New Parliament Houses.
The Australian Fossil Mammal Site (Naracoorte) is also on the World Heritage List.
There are 17 state heritage areas (created under the provisions of the Development Act 1993) in South Australia. The number of local heritage places designated in council development plans has increased by 480 since 2008.
The total number of shipwrecks protected has increased by 13 since the last state of the environment report (from 392 to 405). Shipwrecks serve as artificial reefs and thus are important marine habitats. Conservation and protection of these sites is important not only for maintaining the heritage value of the site, but also for protecting the natural environment associated with the wreck. Increased development pressure on the marine environment has the potential to affect underwater cultural heritage sites.
The South Australian Government assists local government with desired character provisions, heritage policies and design guidelines in council development plans. The government provides funding and heritage advisers to assist local councils and owners of local heritage places to assess and manage heritage assets. The government also has an asset management program for maintaining its own heritage buildings; since the 2008 state of the environment report, the approximately 400 heritage sites have been reviewed to prioritise program funding.
As part of the new urban design being promoted by the South Australian Government, there will be increased opportunity to adaptively reuse heritage buildings. This protects the heritage of the building and the surrounding neighbourhood character, and reduces the need for new construction with the associated use of raw materials and energy. Guidelines on sympathetic development of state heritage places and within state heritage areas have been developed to assist owners in lodging well-considered applications that can be processed more quickly and efficiently, and improve consistency in assessment. The development of heritage works plans will enable owners to prioritise and plan the maintenance and repair of heritage places.
Developments in and near shipwrecks require the development application to be referred to the Department of Environment, Water and Natural Resources (DEWNR) under the provisions of the Development Act 1993 and the Development Regulations 2008. In addition, the DEWNR undertakes an awareness program to reduce potential damage to shipwreck sites from anchors, recreational divers and boat owners.
The future of heritage places of world, national, state and local significance located in South Australia will rely on systematic ongoing assessments to inform a comprehensive register of heritage assets, and adequate resources (both funding and skills) for managing those assets. This requires periodic evaluation of the extent to which current systems succeed in identifying places of heritage value and the effectiveness with which heritage assets are managed.
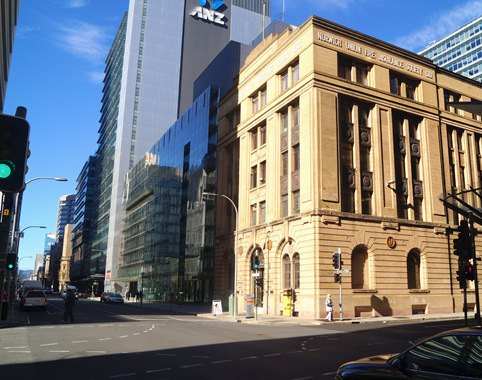
Woodards House, Adelaide
Tobias Hills