Changing state of our land
Since European settlement, Australia has had the highest extinction rates of animals in the world – at least 30 species of mammals and 29 of birds. A recent study by the CSIRO estimates another 7 Australian mammals and 10 birds will become extinct within 20 years unless their conservation improves.
Of birds most at risk, most are endemic to islands or occur in southern Australia. They include the South-eastern Red-tailed Black Cockatoo that survives on a very specific diet of seeds from stringybark trees in a small, declining area straddling the Victoria–SA border.
It is estimated these birds would take 37 years to replace the adult breeding population. Because of encroaching desert boundaries and expanding agriculture, their food sources and nesting areas are being cleared, leaving them without nutrition or the opportunity for reproduction.
Most of the trends identified in the 2013 SOER remain relevant today, and are reaffirmed in the 2016 Australia SOER, as follows:
- Australia’s biodiversity is under increased threat and overall, continues to decline.
- Many species and communities suffer from cumulative impacts of multiple pressures.
- Impacts of climate change are increasing.
- Even for relatively well-known Australian animals, monitoring data is often inadequate to robustly assess their state and trends. The lack of data is more pronounced for plants, amphibians and reptiles, and even more so for cryptic taxa such as freshwater fish, invertebrates and fungi, for which very little information is available.
- Australia is unable to measure the effectiveness of most of our investments in biodiversity or pressures management. The outcomes of management actions are rarely monitored and reported for long enough to clearly demonstrate effectiveness.
- The outlook for Australian biodiversity is generally grim, given the current overall poor status, deteriorating trends and increasing pressures.
- Our current investments in biodiversity management are not keeping pace with the scale and magnitude of current pressures. Resources for managing biodiversity and for limiting impact of key pressures mostly appear inadequate to arrest the declining status of many species. Biodiversity and broader conservation management will require major investments across long timeframes to reverse deteriorating trends.
Since the previous SOER report, the SA Government has produced a set of trend and condition reports to meet the requirement of the Natural Resources Management Act 2004 for the Environment Minister ‘to keep the state and condition of the natural resources of the State under review’. Not surprisingly, the 9 reports prepared in relation to the Land theme confirm the predominantly declining trends previously reported, as indicated in Figure 45.
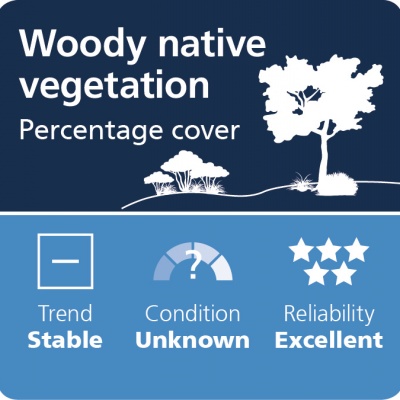
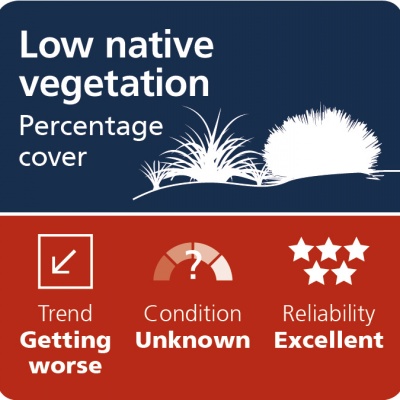
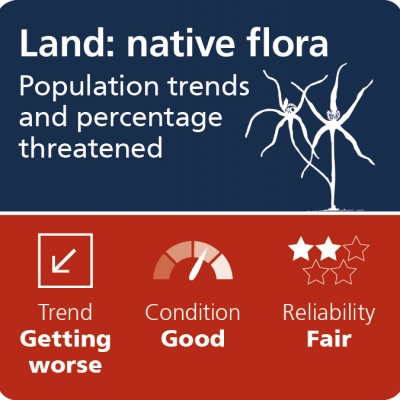
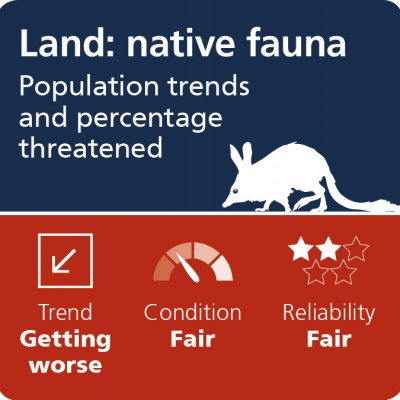
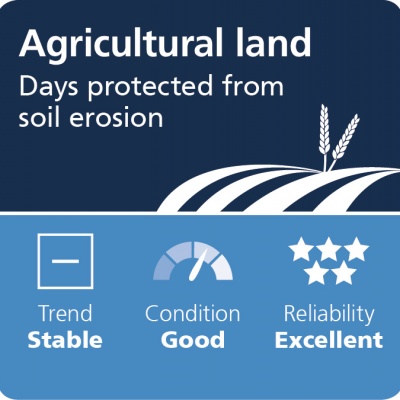
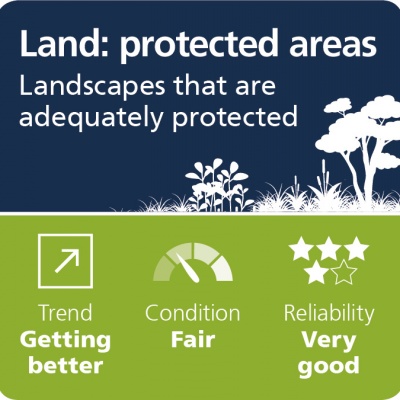
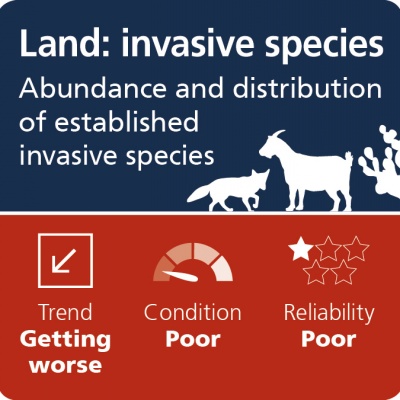
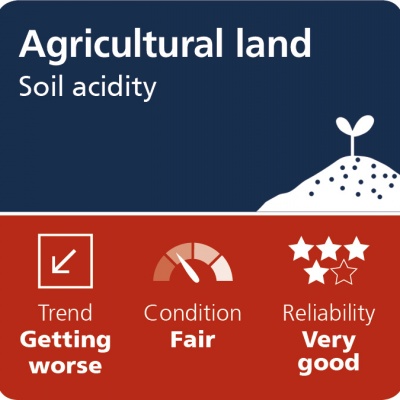
Figure 45: Trend and condition reports for land in South Australia
Assessments provided in these reports acknowledge there is inadequate information for some natural resources. For example, reliability of information about abundance and distribution of established invasive species is assessed as ‘poor’, while information about population trends of our native plants and animals, and the proportion threatened, has been assessed at only ‘fair’.
Soils
The SA Government monitors and reports on trends in the condition of soil in the agricultural areas of SA. Monitoring provides a scientific basis to inform and contribute to natural resources management policy and encourage sustainable agricultural practices.
Key indicators of soil condition are:
- erosion protection
- soil acidity
- soil salinity
- soil carbon
- physical condition
- nutritional fertility.
Since 2005, soil acidity has been increasing in 6 key agricultural regions – Eyre Peninsula, Northern and Yorke, Adelaide and Mount Lofty Ranges, Murray–Darling Basin and the South East. Two-thirds of acid-prone soils in the agricultural areas of the state are acidic and this area is increasing.
Mapping of soil carbon storage revealed about 2.17 Gt (gigatonnes) or 8.68% of the approximately 25 Gt of carbon in Australian soils, occurs in soils in SA (Figure 46).
 Figure 46: Soil carbon storage across Australia. Source: CSIRO
Changing climatic conditions will be a key determining driver for our future soil condition, both in terms of impact on the inherent properties of soil itself as well as in the relationship between soils and above-ground communities.
The 2016 Australia SOER highlights our lack of knowledge about the threat of climate change to our soils and recognises the contribution of the Biome of Australian Soil Environments project to help fill knowledge gaps about Australian soil microbial communities.
Native vegetation
New species
On average, around 2,000 new plant species are identified annually worldwide. The International Plant Names Index, covering vascular plants, is the product of a collaboration between the Kew–Harvard University Herbaria and the Australian National Herbarium. It provides the most comprehensive and regularly updated listing of scientific names for vascular plants. Australia is one of the top 3 source countries for new species of vascular plants entered into the index over the past decade.
Newly identified species are categorised according to their physical (morphological) and molecular characteristics, and their similarity to plants already known to science. This enables their evolutionary relationship to other plants to be determined and allows them to be placed in a plant family.
Trends in vegetation cover
Information about South Australian vegetation is recorded using the National Vegetation Information System. This provides a nationally consistent standard for describing and compiling data for native vegetation types. The remnant native vegetation mapping contains several attributes, including extent, type, structure, dominant species and stratum characteristics.
Earlier this year, the government published the South Australian Land Cover Layers, which provides new estimates of native vegetation cover and trends in SA. The results are presented at 3 scales—for the whole of SA, each 3 rainfall regions and each natural resources management region. The new data indicates that native vegetation covers 88% of SA, which is slightly higher than the previously reported 86%. The changes do not imply an increase in cover, but rather an improvement in the quality of information.
The most significant changes in estimated cover are in the Adelaide and Mount Lofty Ranges, where vegetation cover, based on the new information, is estimated at 32% in comparison with 13% previously and in the South East where vegetation cover is now estimated at 31% in comparison with the previous 17%.
Vegetation cover is not evenly distributed across the state. The 2013 SOER described the arid northern parts (covering 87% of SA) as still having approximately 96% vegetation cover. Only 26% of native vegetation remains in the temperate parts (the remaining 13% of SA) with these areas being highly fragmented through clearing for agriculture and human settlement since European arrival.
Agricultural land covers about 53% of the state, with 42% used for grazing of native vegetation and the remaining 11% for cropping, modified pastures for sheep and cattle, and horticulture.
The new data distinguishes between 17 land-cover classes, as presented in Figure 47, and shows the presence of native vegetation. It does not provide information about the quality or condition of the vegetation.
Vegetation types found in SA’s interior are predominantly grassland, shrubland and woodland (Figure 47). Closer to the coast, annual crops and highly modified pastures predominate.
 Figure 47: Land cover classes
An additional 2,123 km² (19%) of previously unmapped native vegetation in Adelaide and the Mount Lofty Ranges, 8,376 km² (14%) in the South East and 12,000 km² (4%) in the agricultural zone were identified in this new data (Table 17). This resulted from new mapping methods capturing a broader range of vegetation extent and type, including roadside and riparian vegetation, together with types not well captured previously, such as grassland and wetland.
Table 17: New estimates of native vegetation cover
| Region | SA vegetation | SA land cover | ||
|---|---|---|---|---|
| Previous % area | New % area | New area (km2) | New % in PAs | |
| Adelaide and Mount Lofty | 13% | 32% | 2,123 | 12% |
| Alintyara Wilurara | 100% | 100% | 279,542 | 52% |
| Eyre Peninsula | 46% | 51% | 26,434 | 39% |
| Kangaroo Island | 52% | 59% | 2,607 | 57% |
| Northern & Yorke | 37% | 36% | 12,552 | 6% |
| South Australian Arid Lands | 94% | 96% | 500,562 | 21% |
| South Australian Murray–Darling Basin | 53% | 61% | 34,435 | 34% |
| South East | 17% | 31% | 8,376 | 35% |
| Arid Zone | 94% | 97% | 780,095 | 32% |
| Agricultural Zone | 44% | 48% | 86,527 | 32% |
| Statewide | 86% | 88% | 866,632 | 32% |
Source: Department for Environment and Water
The new results distinguish trends in land cover between 1987 and 2015 based on rainfall regions.
The data confirms the general trend, since 1987, of a reduction in the area of native vegetation in favour of agriculture, plantations and urban development (Table 18). Some variation in these patterns were seen for Kangaroo Island with conversion of dryland agriculture to plantation hardwood timber, and in Adelaide and the Mount Lofty Ranges with conversion of dryland agriculture and native vegetation to urban and built-up areas.
Table 18: Regional landscape patterns 1987–15

High rainfall agriculture (Adelaide and Mount Lofty Ranges, Kangaroo Island and South East)

Low rainfall agriculture (Eyre Peninsula, Northern and Yorke, and SA Murray–Darling Basin)

Arid (Alinytjara Wilurara and SA Arid Lands)
Threatened species
Plants
Threatened plants (and other species) are listed under the National Parks and Wildlife Act 1972 under three categories – endangered, vulnerable and rare.
There are currently over 100 SA plant species listed as nationally threatened under the Environment Protection and Biodiversity Conservation Act 1999. A total of 828 plant species are listed as threatened under the National Parks and Wildlife Act 1972. Of these, 41 are considered to be extinct in SA.
The number of plants listed as vulnerable and rare (196 and 431 respectively) remained the same between 2012 and 2015, while the number listed as endangered increased by 26 from 161 to 187. These figures should be treated with caution as the process for listing relies on a nomination process that is constrained by inadequate information and resources.
The SA Government’s 2018 Trend and Condition Report Card on population trends and vulnerability of SA plants indicate the proportion of land plants threatened across SA is estimated as 12% with the trend getting worse. However, as qualified in the report card, the data used is relatively aged, limited in scope and availability, and largely based on expert opinion. At a regional level, the estimates varied between 19% in the Adelaide and Mount Lofty Ranges, and Kangaroo Island regions to 1% in the Alinytjara Wilurara region.
Of SA’s 5 threatened plant indicator species, two are improving (Small-flowered Daisy-bush and Monarto Mintbush), one is declining (Pink-lipped Spider-orchid) and two are stable (Hindmarsh Valley Greenhood and White Beauty Spider-orchid).
Animals
According to the SA Government’s 2018 trend and condition report cards on population trends and vulnerability of SA animals, 12% of native animals are threatened. The report cards considered this as getting worse.
At the regional level, this varied between 23% in the Adelaide and Mount Lofty Ranges to 4% in the Alinytjara Wilurara and SA Arid Lands regions. The data was qualified as relatively aged, limited in scope and availability, and largely based on expert opinion.
Of SA’s 4 terrestrial threatened mammal indicator species, the condition of one is improving (Yellow-footed Rock Wallaby), one is declining (Southern Brown Bandicoot) and 2 remain unchanged (SA Mainland Tammar Wallaby and Southern Bent-wing Bat).
Of the 5 threatened bird indicator species, one is improving (Glossy Black Cockatoo), 2 are declining (Mount Lofty Ranges Southern Emu-wren and Black-eared Miner) and 2 remain unchanged (Malleefowl and South-east Red-tailed Black Cockatoo).
For both plants and animals, there is no systematic monitoring of species or periodic review of threatened species lists.
The close link between some bird species and their habitats make them useful for identifying ecosystem health. They can be indicators of deteriorating habitat quality and environmental pollution, as well as determinants of success of restoration efforts.
BirdLife Australia produce regular national assessments of the state of Australia’s birds, and also publish an assessment of trends in bird numbers and distribution on a regional level every five years. The organisation also provides 10-yearly updates on the status of Australia’s bird taxa. The Action Plan for Australian Birds 2010 assesses 27 taxa as extinct, 20 as critically endangered, 60 as endangered, 68 as vulnerable and 63 as near threatened.
The State of Australia’s Birds 2015 assesses trends on a regional level and across functional groupings of birds. Based on data up to 2013, major trends reflect an overall decline in the state of our birds.
Case study
‘Canary in a coalmine’
 Mallee Emu-wren
The Mallee Emu-wren (Stipiturus mallee) is one of Australia’s smallest birds, weighing around 6 grams. It is endangered nationally, as well as in SA and Victoria.
The Murray Mallee region, straddling the SA–Victoria border, is an important habitat for the remaining population, which has been declining due to native vegetation clearance, drought and fire. In SA, a small population in Billiatt Conservation Park has not been confirmed since 2003 and, until recently, the SA population was restricted to less than 100 birds in Ngarkat Conservation Park. This population has now also been assessed as extinct, mainly due to fire.
In 2017, the Australian Government’s Threatened Species Recovery Fund allocated a grant of $200,000 to support an effort to relocate 60–80 of the birds from Victoria back into their former range within Ngarkat Conservation Park. The survival of the new population will be dependent on future fire regimes and climate change.