Changes in water use, quality and supply
In spite of being known as ‘the driest state on the driest inhabited continent’ and stark reminders in the form of periodic droughts, SA has been able to cope with its limits on water availability through more efficient water use, greater diversification of water sources and improved water quality.
There has been a gradual improvement in the efficiency of water use and in land management practices over time, with the most persistent issues linked to historic practices, mainly native vegetation clearance.
The SA Government has developed 9 trend and condition reports for inland waters and 9 reports for the River Murray, as summarised in Figures 35 and 36.
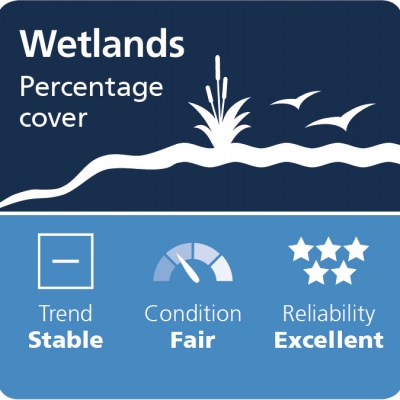
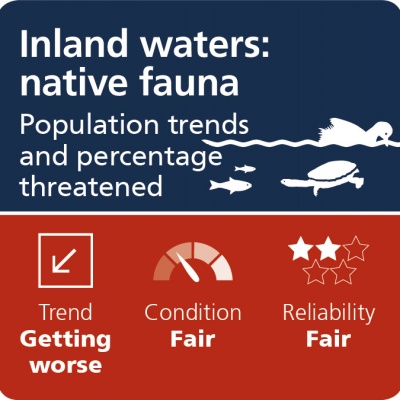
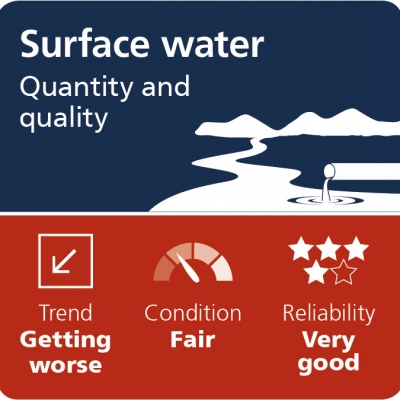
Inland waters
Report Card Gallery - waters
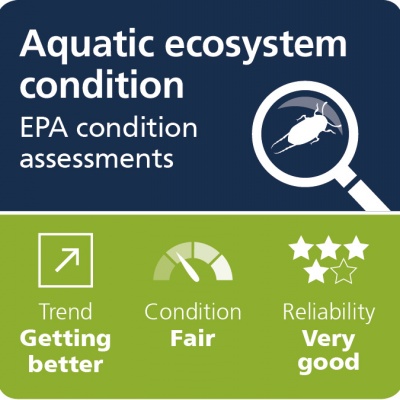
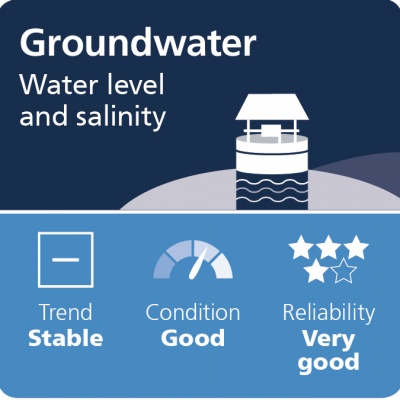
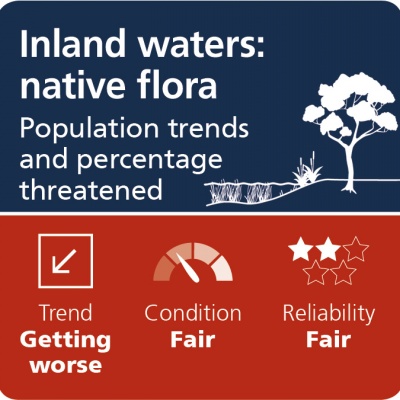
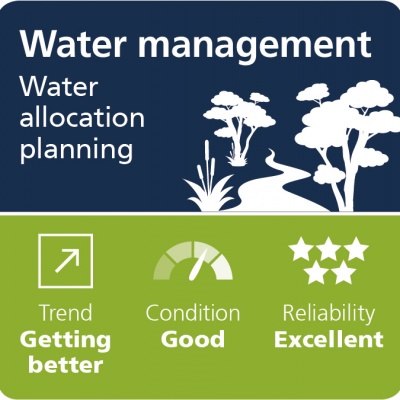
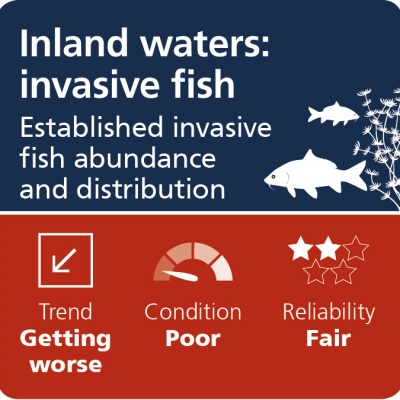
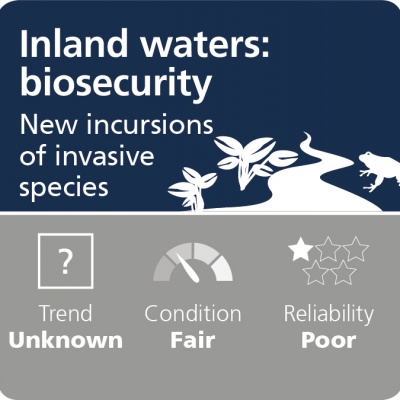
The conditions across these indicators is variable. Water resources are the ecosystems that depend on them were rated as poor or fair, reflecting the pressures on them. The management of water resources was rated as good. South Australia has relatively few aquatic weeds and pests, and there have been no new incursions in the last five years.
Figure 35: Trend and condition reports for inland waters in South Australia
The condition across these indicators is variable. Water resources and the ecosystems that depend on them were rated as poor or fair, reflecting the pressures on them. The management of water resources was rated as good. South Australia has relatively few aquatic weeds and pests, and there have been no new incursions in the last 5 years.
River Murray
Report Card Gallery - River Murray
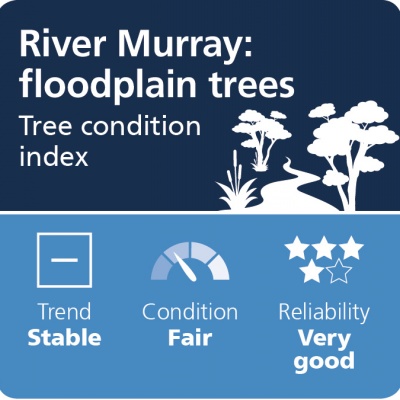
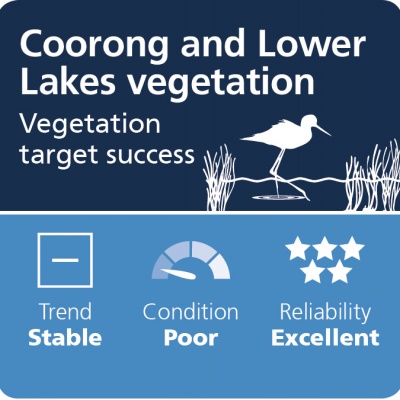
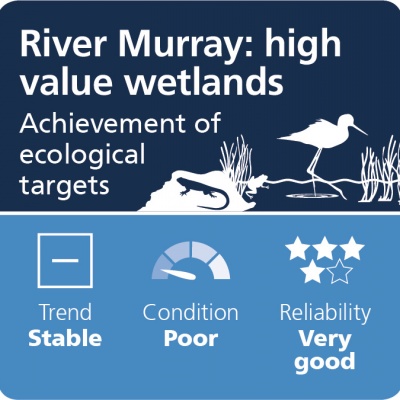
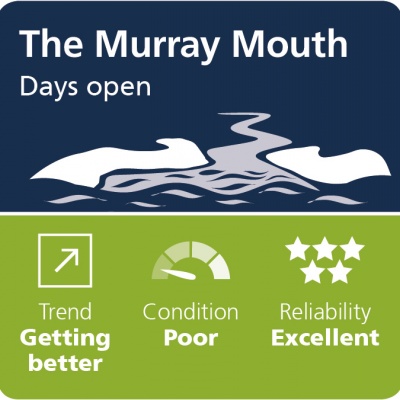
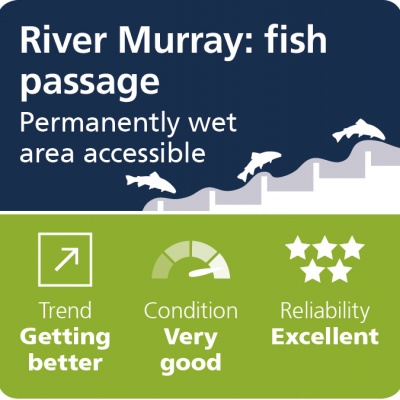
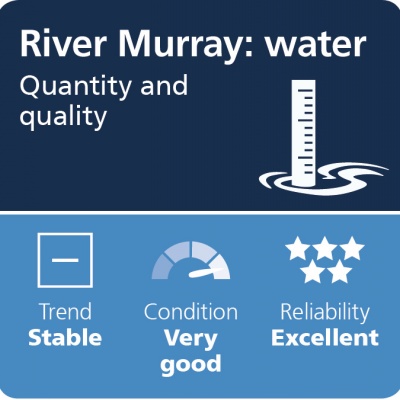
Figure 36: Trend and condition reports for the River Murray in South Australia
Improvements in the timing and volume of flows to SA have led to improvements in native fish populations, and aquatic and shoreline vegetation. Salinity targets are being met, and the Murray Mouth has been open more often. Unfortunately, the improved flows have not been sufficient to improve the health of some iconic floodplain trees, which continue to decline in health.
Aquatic ecosystem condition
One of the trend and condition reports (aquatic ecosystem condition) is based on assessments undertaken by the EPA. Since 2008, the EPA has carried out 544 assessments of aquatic ecosystem condition across all of SA’s regions, using a 6-tiered condition rating system, ranging from ‘excellent’ to ‘very poor’ (Figure 37).
The assessment uses a range of science-based approaches and models that capture the biological, chemical and physical changes occurring in streams and lakes in relation to increasing levels of disturbance.
 Figure x: Rating system for assessments of aquatic ecosystem condition
The EPA has not rated any site as ‘excellent’ since the monitoring program began in 2008. It has rated 17 as ‘very good’, 95 as ‘good’, 209 as ‘fair’, 191 as ‘poor’ and 32 as ‘very poor’ (Figure 38).
 Figure 38: Assessments of aquatic ecosystem health from 2008–16
With the degree of human disturbance across SA, and the typically low flow volumes in most creeks and streams, it is not surprising a greater proportion of sites are in ‘poor’ rather than ‘good’ condition.
The distribution of assessments across various regions of SA is particularly interesting, as seen in Figure 39.
 Figure 39: Distribution of assessments across various regions of SA
In general, the differences between regions are due to rainfall levels and degree of native vegetation clearance. The better sites being located in high rainfall areas with catchments still having a high percentage of native vegetation.
Adelaide and Mount Lofty Ranges
The Adelaide and Mount Lofty Ranges region has been extensively cleared since European settlement, with only about 15% of the original vegetation remaining (Figure 40). The remnant native vegetation exists in relatively undisturbed locations, such as conservation parks, steep hills, gullies, along creek lines and as part of roadside vegetation. Agriculture dominates the region (mostly stock grazing and cereal cropping), and there are extensive urban areas, including the city of Adelaide.
 Figure 40: Aquatic health report for the AMLR NRM region
Kangaroo Island is a case in point where there is a clear trend of ‘good’ to ‘poor’ assessment results moving from west to east. The streams in good health are on the high rainfall and more vegetated western end of the island. Land use is dominated by nature conservation throughout the western end. Cropping, stock grazing and forestry dominate the middle and eastern parts of the island. Eastern parts typically only retain patches of remnant native vegetation along hilltops, creek lines, roadsides and around salt lakes and swamps.
Case study
Kangaroo Island shows a clear trend from ‘very good’ aquatic ecosystem health in the west to ‘increasingly poorer’ conditions going east. This reflects the changing intensity of human disturbance, with the west characterised by more intact native vegetation and fresh water, and the east more developed and showing higher levels of salinity.

In response, the Kangaroo Island Natural Resources Management Board has:
- implemented policies that affect water with defined water-use limits. Available data was used to establish surface water runoff and rainfall relationships, and to estimate catchment yields
- carried out rehabilitation works on 4 nationally significant wetlands, including more than 45 ha of revegetation, and weed, feral pig and peacock control
- installed 6 new stream flow-gauging stations since 2009, and collected baseline water quality and quantity data
- developed a salinity risk assessment tool for all water-affecting activities
- supported widespread protection of areas of land in the vicinity of rivers and streams, by including fencing, revegetation and stock crossings.
Northern and Yorke and SA Arid Lands
Eyre Peninsula
South East
SA Murray–Darling Basin
Eastern Mount Lofty Ranges
Previous targets
Stormwater harvesting
Wastewater recycling
Sustainable water use
River Murray flows
The target to increase environmental flows in the River Murray to ensure adequate water for a healthy river system has been achieved and exceeded through recovery of water for the environment under the Living Murray Program, the Murray–Darling Basin Plan, as well as water held by the SA Government for environmental use (including as part of the funding agreement for the Adelaide Desalination Plant). The Basin Plan environmental water management framework now provides the primary means for coordinating environmental water use across the Murray-Darling Basin.
Read more about the progress of water recovery under the Basin Plan at Murray‒Darling Basin Authority
Meeting the Basin Plan targets by itself does not guarantee adequate environmental flows to ensure a healthy River Murray, and some habitat loss will continue.
River Murray salinity
The target to maintain a positive credit balance on the Murray‒Darling Basin Authority salinity register is being met, with SA maintaining a positive credit balance of $7.035 million per year on the Salinity Register as at November 2016. U
nder the Murray‒Darling Basin Agreement, SA is responsible for actions that change salinity in the River Murray. For example, increased irrigation results in a debit on the salinity register, whereas salt interception, improved irrigation efficiency and rehabilitation of drainage schemes result in credits.
EPA reported incidents
The EPA maintains a pollution reporting and enquiries hotline. As shown in Figure 41, there has been an upward trend in the number of calls related to the pollution of water during 2013‒14 to 2016‒17. This may be a result of the increased awareness created through the EPA’s community engagement and the development of the Environment Protection (Water Quality) Policy 2015.
 Figure 41: Water pollution incidents and enquiries
Following the introduction of the Local Nuisance and Litter Control Act 2016, local councils are starting to deal with more of these incidents and enquiries.
Emergency response incidents are included in these figures. The EPA provides a 24-hour on-call Emergency Response Team (ERT) responding to requests for expert advice and incident attendance in relation to emergency pollution and hazardous substances. Of the 433 incidents reported to the ERT during 2015‒16, a total of 121 were related to water pollution. Most of these came from the public, which indicates a good awareness of the importance of our water resources.