2 What do we know about it?
South Australia has diverse water resources. They range from relatively large quantities of surface-water resources in the south-east, inflows to South Australia from the Murray–Darling Basin, and groundwater of the Great Artesian Basin, to smaller creeks and groundwater systems. The state’s natural geological and climatic conditions, which vary widely, as well as human-related factors, influence the condition, quantity and quality of water resources.
In addition to surface-water and groundwater resources, sea water has in recent years received increased attention as a source of water for desalination, to produce water for human consumption, mining and some other potential uses. Treated wastewater and urban stormwater are additional resources, which are increasingly being managed to address the environmental impacts they can have on natural water resources and, where appropriate, to also provide a source of water.
Box 1 provides information about South Australia’s water use.
South Australia regularly monitors water quality, water management and the environmental condition of the states’ rivers, lakes and coastal waters. The following section looks at sustainable management assessment, and environmental assessments for the River Murray and Lower Lakes, surface waters and groundwater.
Box 1 South Australian water use facts, 2010–11
- Water consumption in South Australia in 2010–11 was 1023 gigalitres (GL) compared with 1110 GL in 2009–10,
a decrease of 8%. - Water consumption per capita was 617 kilolitres (kL).
- Households consumed 115 GL in 2010–11, a slight decrease from 123 GL in 2009–10. Water consumption per household decreased from 75 kL in 2009–10 to 70 kL in 2010–11.
- Agriculture was the largest consumer of water, accounting for 646 GL (63%) of the total water consumption in South Australia.
- The manufacturing industry was a significant user of water, accounting for 8% of total water use. Its consumption increased 10% from 2009–10 to 84 GL. Mining consumed 24 GL of water, while the electricity and gas supply industry consumed 2 GL.
- Gross state product was $84 million per GL of water consumed, an increase of $9 million per GL from the previous year.
- The gross value of irrigated agriculture in South Australia in 2010–11 was $1429 million, up from $1360 million in 2009–10.
- The average water price was $3.09 per kL.
- South Australian households recorded an expenditure of $354 million on urban distributed water.
- The total volume of water distributed in South Australia in 2010–11 was 315 GL, a 17% decrease from 2009–10. Distribution water losses amounted to 26 GL (8%) of total distributed water supply.
- The use of reuse water decreased from 32 GL in 2009–10 to 25 GL in 2010–11. Agriculture used most of the reuse water (50%; 13 GL).
Source: ABS (2012)
2.1 Sustainable management assessment
South Australia is divided into 67 self-contained water management areas, defined by natural catchments, groundwater resource areas and administrative boundaries.
As part of reporting on South Australia’s Strategic Plan targets (Government of South Australia 2011a), each area is assessed with regard to whether demand is being managed within sustainable limits. The most recent audit, prepared by the plan’s independent Audit Committee in 2012, identified 35 areas as managed within sustainable limits, 25 as partially managed within sustainable limits and 7 as not managed within sustainable limits.
In South Australia’s Strategic Plan progress report 2012 (SASP Audit Committee 2010), the Audit Committee deemed that the proportion of South Australian water management areas assessed as being managed within sustainable limits had not changed significantly between 2003 and 2012, and it was unlikely that the Strategic Plan target—for South Australia’s water resources to be managed within sustainable limits by 2018—would be achieved.
South Australia’s per person water use decreased from 726 kilolitres in 2008–09 to 617 kilolitres in 2010–11 (Figure 1). Although this is an encouraging trend, the average consumption is still higher than in Victoria, Western Australia and the Australian Capital Territory, and the average for Australia.
Agriculture continues to be the largest consumer of water, using more than 50% nationally and more than 60% in South Australia (ABS 2012). While water consumption by the agricultural sector for the whole of Australia remained stable between 2008–09 and 2010–11, it decreased by about 18% in South Australia over the same period (Figure 2).
2.2 Environmental assessment
The South Australian landscape supports a rich variety of riverine and wetland habitats with water-dependent ecosystems. We have a good understanding of the ecology of wetland systems of the South East and Murray–Darling Basin, but for some other areas scientific data are lacking. There is ongoing work to classify wetlands across South Australia to inform planning and management. This work is largely complete in the South East and Murray–Darling Basin, but not in many other areas of the state.
-01_fmt.jpeg)
Source: ABS (2012)
Figure 1 Total water use per person by jurisdiction, 2008–09 to 2010–11
The South Australian Environment Protection Authority (EPA) monitors South Australia’s rivers, lakes and coastal waters to assess their environmental condition, based on a descriptive model for interpreting change in ecological condition in relation to increasing levels of human disturbance (Figure 3). Monitoring data are used to produce aquatic ecosystem condition reports that provide information on the location and special features of waterways, provide findings of assessments, and identify pressures and management responses. The reports rate aquatic ecosystems on a six-point scale, ranging from ‘very poor’ to ‘excellent’. Additional information on the assessment process is provided in Section 4.5.3. The reports and more detailed information on the assessment process are also available on the EPA website: www.epa.sa.gov.au.
Assessments have been conducted in seven of the eight natural resource management (NRM) regions (see the Introduction for more information about NRM regions).
Overall, the aquatic ecosystem reports identify the condition of the majority of the state’s rivers and creeks as lying on the rating spectrum between ‘fair’ and ‘very poor’. Very few are observed to be in a ‘good’ or ‘very good’ condition, and none are in ‘excellent’ condition (EPA 2013).
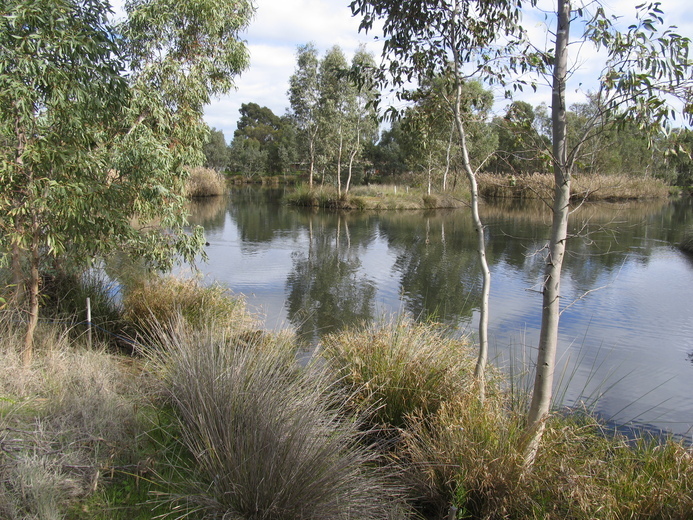
Urrbrae Wetlands
Barbara Hardy Institute
-01_fmt.jpeg)
Source: ABS (2012)
Figure 2 Agricultural water use by jurisdiction, 2008–09 to 2010–11
2.2.1 River Murray and Lower Lakes
The River Murray and Lower Lakes were severely stressed in 2007–09, when the lowest flows in more than 100 years occurred. Many riverine wetlands were isolated and dried, and water quality in the Lower Lakes deteriorated as a result of the lack of flushing of the lake system, which led to very high salinity, turbidity, nutrient and algal levels (Mosley et al. 2012). Acidification due to exposure of acid sulfate soils was reported in dry riverine wetlands and around the lake margins (Lower Lakes Acid Sulfate Soils Scientific Research Committee 2010).
Since 2010, increased river flows have reconnected and flooded most riverine environments. Water quality has recovered well in Lake Alexandrina, but poorer water quality is persisting in Lake Albert as a result of limited water exchange between the lakes. Ecological recovery is in progress in many of the marginal river and lake environments, although some pre-drought species are still absent. Acidity persists in the sediments and pore water (water occupying the spaces between sediment particles) of parts of the Lower Lakes.
A major ‘blackwater’ event occurred in the middle reaches of the Murray in 2011, as low-oxygen water from flooded floodplains and wetlands returned to the river system. Blackwater is a natural process in which the breakdown of organic matter such as leaf litter in water uses up oxygen in the water at a rate faster than it can be replenished. The lack of dissolved oxygen can cause the death of fish, crayfish and other aquatic animals. Blackwater events are a high risk following floods and in the presence of large volumes of leaf litter, and are more likely in warm weather. In the 2011 blackwater event, no major fish kills were observed in South Australia, and the water was mostly re-oxygenated by the time it reached the Lower Lakes.
A new issue emerged in 2011 with discovery of acid drainage water in the Lower Murray Reclaimed Irrigation Area, due to exposure of acid sulfate soils by a falling watertable.
Eight sites within the Lower Lakes have been assessed over 2010–11 using the descriptive model shown in Figure 3. Most sites were given a ‘poor’ rating because the ecosystem showed evidence of major changes in animal communities and plant life, and moderate changes in the way the ecosystem functioned.
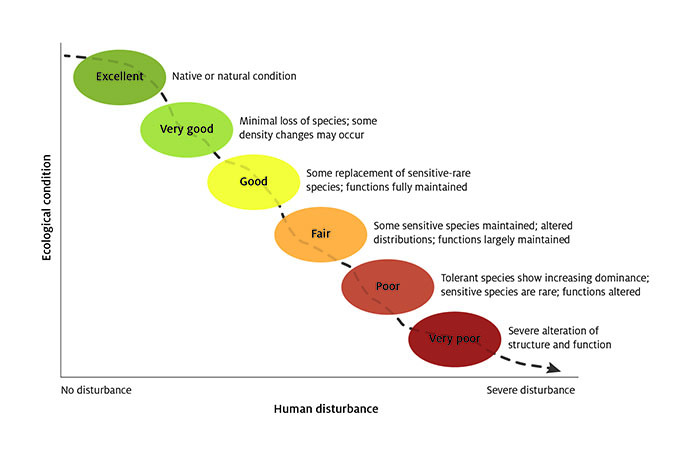
Source: Davies and Jackson (2006)
Figure 3 Ecological condition versus level of human disturbance
2.2.2 Other surface waters
The streams in the state that are classified as being in better condition typically occur where large areas of native vegetation have been retained and where streamflows occur in spring.
The rivers in the Lake Eyre Basin, which are among the last unaltered dryland river systems in the world, are generally considered by governments and the community to be in relatively good condition. However, our knowledge of the ecology of these arid rivers and their catchments is limited and not uniform across the basin.
In agricultural areas, streams are often nutrient enriched, are silted, have riparian zones with few or no native plants, and are dominated by introduced grasses and weed species. Urban streams invariably rate poorly because of disturbances that affect aquatic organisms, water quality and habitat structure. These disturbances include stormwater inflows, channelisation works, weed invasion, and occasionally point-source discharges from wastewater treatment plants and industries.
The most environmentally significant streams identified since sampling began in 1994 are:
- Adelaide and Mount Lofty Ranges NRM region: First, Sixth, Brownhill, Fourth and Aldgate creeks, and parts of Cox Creek and Sturt River
- Eyre Peninsula NRM region: Tod River catchment; and Coonta, Mine, Poonana and Yeldulknie creeks
- Kangaroo Island NRM region: Rocky, Breakneck, Stunsail Boom, North-west, Harriet and upper Cygnet rivers
- Northern and Yorke NRM region: Mary Springs upstream from Beetaloo Reservoir, and upper Skillogalee Creek
- South Australian Arid Lands NRM region: Spring and Mambray creeks, most streams north of the Willochra catchment (e.g. Parachilna, Brachina, Balcanoona creeks) and Cooper Creek
- South Australian Murray–Darling Basin NRM region: Finniss River catchment, including the tributary (e.g. Meadows, Tookayerta and Nangkita creeks)
- South East NRM region: Drain M, Mosquito Creek catchment, Drain L, Reedy Creek and the coastal drains east of Port MacDonnell (e.g. Eight Mile, Deep and Piccaninnie creeks).
Table 1 is a summary of the assessments by NRM region.
|
Year assessed and NRM region |
|||||||||||||||||||||||||||||||||||||||||||||||||||||||||||||||||||||||||||||||||||||||||||||||||||
|---|---|---|---|---|---|---|---|---|---|---|---|---|---|---|---|---|---|---|---|---|---|---|---|---|---|---|---|---|---|---|---|---|---|---|---|---|---|---|---|---|---|---|---|---|---|---|---|---|---|---|---|---|---|---|---|---|---|---|---|---|---|---|---|---|---|---|---|---|---|---|---|---|---|---|---|---|---|---|---|---|---|---|---|---|---|---|---|---|---|---|---|---|---|---|---|---|---|---|---|
|
AMLR = Adelaide and Mount Lofty Ranges; EP = Eyre Peninsula; KI = Kangaroo Island; NY = Northern and Yorke; SAAL = South Australia Arid Lands; SAMDB = South Australian Murray–Darling Basin; SE = South East Note: The method was tested on sites from several regions in 2008, but subsequent assessments only focus on one or two regions in each sampling year. The detailed monitoring results can be viewed on the EPA website (www.epa.sa.gov.au/environmental_info/water_quality/aquatic_ecosystem_monitoring_evaluation_and_reporting). | |||||||||||||||||||||||||||||||||||||||||||||||||||||||||||||||||||||||||||||||||||||||||||||||||||
|
2008 |
2009 |
2010 |
2011 |
2012 |
|||||||||||||||||||||||||||||||||||||||||||||||||||||||||||||||||||||||||||||||||||||||||||||||
|
Condition |
AMLR |
KI |
NY |
MDB |
SE |
EP |
SAMDB |
AMLR |
NY |
SAAL |
|||||||||||||||||||||||||||||||||||||||||||||||||||||||||||||||||||||||||||||||||||||||||
|
Excellent |
0 |
0 |
0 |
0 |
0 |
0 |
0 |
0 |
0 |
0 |
|||||||||||||||||||||||||||||||||||||||||||||||||||||||||||||||||||||||||||||||||||||||||
|
Very good |
0 |
0 |
0 |
0 |
0 |
0 |
1 |
1 |
1 |
5 |
|||||||||||||||||||||||||||||||||||||||||||||||||||||||||||||||||||||||||||||||||||||||||
|
Good |
5 |
0 |
0 |
2 |
2 |
0 |
5 |
10 |
3 |
29 |
|||||||||||||||||||||||||||||||||||||||||||||||||||||||||||||||||||||||||||||||||||||||||
|
Fair |
16 |
3 |
5 |
7 |
24 |
11 |
23 |
27 |
5 |
18 |
|||||||||||||||||||||||||||||||||||||||||||||||||||||||||||||||||||||||||||||||||||||||||
|
Poor |
13 |
3 |
2 |
4 |
40 |
15 |
14 |
24 |
2 |
2 |
|||||||||||||||||||||||||||||||||||||||||||||||||||||||||||||||||||||||||||||||||||||||||
|
Very poor |
6 |
0 |
1 |
0 |
5 |
4 |
0 |
10 |
0 |
0 |
|||||||||||||||||||||||||||||||||||||||||||||||||||||||||||||||||||||||||||||||||||||||||
|
Total |
40 |
6 |
8 |
13 |
71 |
30 |
43 |
72 |
11 |
54 |
|||||||||||||||||||||||||||||||||||||||||||||||||||||||||||||||||||||||||||||||||||||||||
2.2.3 Groundwater
Groundwater extraction occurs from unconfined aquifers, which receive seasonal recharge from rainfall, and confined aquifers, which are not recharged directly from rainfall.
In 2006–09, below-average rainfall over most of South Australia reduced recharge to a number of unconfined aquifers, and groundwater levels fell. In some NRM regions, such as Eyre Peninsula and South East, these trends have been under way for much longer periods. As a consequence, salinity levels have risen in shallow unconfined aquifers.
In some instances, the sustainability of the groundwater resources has been affected by below-average rainfall. For example, the Polda Basin on Eyre Peninsula is a shallow limestone aquifer that became dry in some locations over 2006–09, and salinities increased, most likely as a result of evapotranspiration from plants associated with the shallow watertable (Figure 4).
Since 2009, above-average rainfall in South Australia has improved recharge and led to a recovery of groundwater levels in most unconfined aquifers. In areas of long-term decline, the levels have not yet fully recovered to normal levels. Extractions from these resources have also decreased significantly, partly because higher rainfall has reduced the demand for irrigation.
Other issues for unconfined aquifers include salinity increases in the upper South East NRM region due to irrigation recycling, and the threat of seawater intrusion in coastal limestone aquifers south of Mount Gambier. Risks to the shallow aquifers beneath Adelaide include industrial spills and leaks of fuels and chemicals, fertilisation of horticultural areas (in particular, the northern Adelaide Plains) and illegal waste disposal.
Although not directly affected by annual rainfall recharge, some confined aquifers experienced an increase in demand and higher extractions from 2006 to 2009. In the Angas Bremer Prescribed Wells Area, where the confined aquifer is overlain by a shallow saline aquifer, the increased abstraction (extraction for human use) resulted in downward leakage and localised increases in salinity. Increased rainfall since 2009 has reduced extractions and restored pressure to pre-drought levels in most areas. Long-term gradual increases in salinity have occurred in the Barossa Valley, and in localised areas in the Willunga Basin, probably due to downward leakage from overlying aquifers.
Demand for groundwater in the far north is increasing as a result of mining activities, with a number of large-scale operations proposed or operating near important groundwater resources, such as the Great Artesian Basin. The far north relies on groundwater for domestic and agricultural uses, and requires a delicate balancing of demand against sustainability.
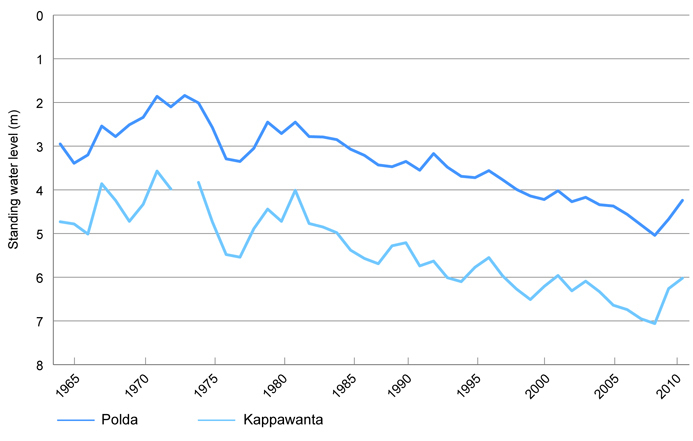
Source: DEWNR (2011)
Figure 4 Groundwater levels in Polda and Kappawanta basins, 1965–2011
Table 2 summarises the 2011 groundwater status reports produced by the Department of Environment, Water and Natural Resources (WaterConnect 2013). The summary reflects the overall increase in groundwater recharge and decline in salinity as a result of above-average rainfall since 2009.
Nutrients (mainly nitrogen) continue to be detected at elevated levels. Probable sources include intensive stock grazing and overapplication of fertilisers in agricultural and horticultural areas. Concentrations of metals occur at several locations, particularly in fractured rock aquifers of the Mount Lofty Ranges where there are, or have been, mines for metals such as copper, gold, lead, silver and zinc.
Historical point sources of contamination include industrial operations on the Adelaide Plains; wastes or spills from industrial sites such as timber mills, gasworks, cheese factories, abattoirs and septic systems in regional areas, including the South East; and mining, ore processing and associated activities in northern areas.
|
Area |
Status |
Water level |
Salinity |
||||||||||||||||||||||||||||||||||||||||||||||||||||||||||||||||||||||||||||||||||||||||||||||||
|---|---|---|---|---|---|---|---|---|---|---|---|---|---|---|---|---|---|---|---|---|---|---|---|---|---|---|---|---|---|---|---|---|---|---|---|---|---|---|---|---|---|---|---|---|---|---|---|---|---|---|---|---|---|---|---|---|---|---|---|---|---|---|---|---|---|---|---|---|---|---|---|---|---|---|---|---|---|---|---|---|---|---|---|---|---|---|---|---|---|---|---|---|---|---|---|---|---|---|---|
|
PWA = prescribed wells area; PWRA = prescribed water resources area | |||||||||||||||||||||||||||||||||||||||||||||||||||||||||||||||||||||||||||||||||||||||||||||||||||
|
Angas Bremer PWA |
|
|
|
||||||||||||||||||||||||||||||||||||||||||||||||||||||||||||||||||||||||||||||||||||||||||||||||
|
Baroota PWRA |
|
|
|
||||||||||||||||||||||||||||||||||||||||||||||||||||||||||||||||||||||||||||||||||||||||||||||||
|
Barossa PWRA |
|
|
|
||||||||||||||||||||||||||||||||||||||||||||||||||||||||||||||||||||||||||||||||||||||||||||||||
|
Booborowie Valley |
|
|
|
||||||||||||||||||||||||||||||||||||||||||||||||||||||||||||||||||||||||||||||||||||||||||||||||
|
Central Adelaide PWA |
|
|
|
||||||||||||||||||||||||||||||||||||||||||||||||||||||||||||||||||||||||||||||||||||||||||||||||
|
Clare Valley PWRA |
|
|
|
||||||||||||||||||||||||||||||||||||||||||||||||||||||||||||||||||||||||||||||||||||||||||||||||
|
Far North PWA |
|
|
|
||||||||||||||||||||||||||||||||||||||||||||||||||||||||||||||||||||||||||||||||||||||||||||||||
|
Lower Limestone Coast PWA |
|
|
|
||||||||||||||||||||||||||||||||||||||||||||||||||||||||||||||||||||||||||||||||||||||||||||||||
|
Mallee PWA |
|
|
|
||||||||||||||||||||||||||||||||||||||||||||||||||||||||||||||||||||||||||||||||||||||||||||||||
|
Marne Saunders PWRA |
|
|
|
||||||||||||||||||||||||||||||||||||||||||||||||||||||||||||||||||||||||||||||||||||||||||||||||
|
McLaren Vale PWA |
|
|
|
||||||||||||||||||||||||||||||||||||||||||||||||||||||||||||||||||||||||||||||||||||||||||||||||
|
Musgrave PWA |
|
|
|
||||||||||||||||||||||||||||||||||||||||||||||||||||||||||||||||||||||||||||||||||||||||||||||||
|
Northern Adelaide Plains PWA T1 aquifer |
|
|
|
||||||||||||||||||||||||||||||||||||||||||||||||||||||||||||||||||||||||||||||||||||||||||||||||
|
Northern Adelaide Plains PWA T2 aquifer |
|
|
|
||||||||||||||||||||||||||||||||||||||||||||||||||||||||||||||||||||||||||||||||||||||||||||||||
|
Northern Adelaide Plains PWA Kangaroo Flat region |
|
|
|
||||||||||||||||||||||||||||||||||||||||||||||||||||||||||||||||||||||||||||||||||||||||||||||||
|
Padthaway PWA |
|
|
|
||||||||||||||||||||||||||||||||||||||||||||||||||||||||||||||||||||||||||||||||||||||||||||||||
|
Peake–Roby–Sherlock PWA |
|
|
|
||||||||||||||||||||||||||||||||||||||||||||||||||||||||||||||||||||||||||||||||||||||||||||||||
|
Southern Basins PWA |
|
|
|
||||||||||||||||||||||||||||||||||||||||||||||||||||||||||||||||||||||||||||||||||||||||||||||||
|
Tatiara PWA |
|
|
|
||||||||||||||||||||||||||||||||||||||||||||||||||||||||||||||||||||||||||||||||||||||||||||||||
|
Tintinara–Coonalpyn PWA |
|
|
|
||||||||||||||||||||||||||||||||||||||||||||||||||||||||||||||||||||||||||||||||||||||||||||||||
|
Walloway Basin |
|
|
|
||||||||||||||||||||||||||||||||||||||||||||||||||||||||||||||||||||||||||||||||||||||||||||||||
|
Willochra Basin |
|
|
|
||||||||||||||||||||||||||||||||||||||||||||||||||||||||||||||||||||||||||||||||||||||||||||||||


 Adverse trends, indicating low risk to the resource in the medium term


 Stable


